응급실 방문한 소아 열 환자에서 Pediatric Risk of Admission 점수 I 및 II와 C-반응단백질 결합모형의 입원 예측성적
Performance of the combined models of Pediatric Risk of Admission scores I and II, and C-reactive protein for prediction of hospitalization in febrile children who visited the emergency department
Article information

Trans Abstract
Purpose
To study the performance of the combined models of Pediatric Risk of Admission (PRISA) scores I and II and C-reactive protein (CRP) for prediction of hospitalization in febrile children who visited the emergency department.
Methods
We reviewed febrile children aged 4 months - 17 years who visited a tertiary hospital emergency department between January and December 2017. White blood cell count, CRP concentration, the PRISA scores, and systemic inflammatory response syndrome score were calculated. We compared areas under the curves (AUCs) of the admission decision support tools for hospitalization using receiver operating characteristic curve analysis.
Results
Of 1,032 enrolled children, 423 (41.0%) were hospitalized. CRP and the PRISA scores were significantly higher in the hospitalization group than in the discharge group (all P < 0.001). Among the individual tools, CRP showed the highest AUC (0.69; 95% confidence interval [CI], 0.66-0.72). AUC was 0.71 (95% CI, 0.69-0.74) for the combined model of the PRISA I score and CRP, and 0.71 (95% CI, 0.68-0.74) for that of the PRISA II score and CRP. The AUC of PRISA score I and CRP combined was significantly higher than that of isolated CRP (P=0.048).
Conclusion
The combined model of the PRISA I score and CRP may be useful in predicting hospitalization of febrile children in emergency departments.
서론
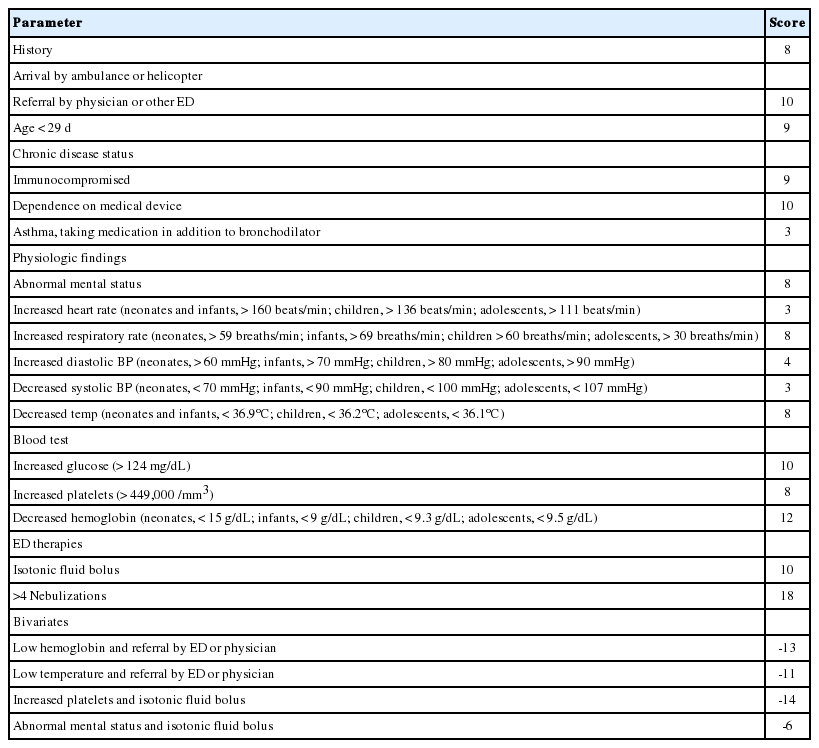
열은 응급환자의 약 31%를 차지하는 소아 응급환자의 흔한 응급실 방문 이유 중 하나이다[1,2]. 약 20%의 소아가 열을 주소로 방문하는데, 이 중 약 26%가 입원하지만[3] 그 기준이 주관적인 것이 현실이다. 입원 기준의 주관적인 면을 보완하려면, 객관적 입원 예측 도구가 필요하다. Pediatric Risk of Admission (PRISA) 점수 I 및 II는 현병력, 과거력, 신체검사, 혈액검사, 응급처치에 기반하여 소아환자 입원을 예측하는 점수 체계이다(Appendix 1) [3-5]. 열 환자에게 흔히 시행하는 염증표지자인 C-반응단백질은 serious bacterial infection (SBI) 예측을 통해 입원 예측에 도움을 준다[6-10]. 한국에서 이러한 도구를 이용한 입원 예측 연구가 부족한 실정이다.
본 저자는 열 환자에서 PRISA 점수 단독 및 여기에 C-반응단백질을 결합한 모형의 입원 예측성적을 평가하고자 본 연구를 수행했다.
대상과 방법
1. 연구대상
2017년 1월부터 12월까지 경상대학교병원 응급실을 방문한 4개월-17세 열 환자를 대상으로 시행했다. 혈액검사 또는 의무기록 누락으로 PRISA I, II, 전신염증반응증후군 점수, C-반응단백질, 백혈구계산 등의 결과를 얻을 수 없는 환자는 제외했다. 본 연구는 경상대학교병원 임상연구심의위원회 승인을 얻은 후 시행했다(IRB No. GNUH 2019-02-006).
2. 자료수집
각 지표를 산출하기 위하여 전자의무기록을 이용하여 후향적으로 자료를 수집했다. 수집한 자료는 응급실 방문 방법, 나이, 성별, 과거력, 혈압, 심장 박동수, 호흡수, 체온, 신체검사 결과, 혈액검사 결과(포도당, 백혈구계산, 헤모글로빈 농도, 혈소판계산, 중탄산이온 농도, 혈액요소질소, C-반응단백질, 칼륨), 응급처치 및 입원 여부, 응급실 7일 이내 재방문, 응급실 방문 30일 이내 사망, 진단명(열 원인)이다. 활력징후, 신체검사, 혈액검사는 응급실 방문 초기에 시행한 결과만을 분석했다.
3. 정의
기존 문헌에 따른 열의 정의(직장 체온 38℃, 겨드랑 체온 37.5℃ 또는 고막 체온 37.6℃ 이상)를 참고하여[11,12], 본 연구에서 열을 고막 체온 37.6℃ 또는 액와 체온 37.5℃ 이상으로 정의했다[11,12]. 진단명은 입원군은 병동 퇴원 진단명을, 퇴원군은 응급실 퇴실 진단명을 각각 사용했으며, 두 군 모두 소아청소년과 의사가 결정한 진단명을 사용했다.
4. 입원 예측 도구
PRISA 점수 I (Appendix 1)은 현병력, 과거력, 신체검사, 혈액검사, 응급처치에 기반하여 교란변수 4종을 보정하여 산출하지만, 응급실에서 사용하기에 다소 복잡하고 타당도 검증이 불충분하다[4]. 이를 보완한 PRISA 점수 II (Appendix 2)는 대규모 환자를 대상으로 타당도를 검증했으며 혈액검사 4종을 포함한 총 16개의 변수를 이용하여 점수를 산출한다. 두 도구의 입원 예측성적에 유의한 차이는 없다고 알려졌다(PRISA scores I vs. II; area under the curve [AUC] 0.83 ± 0.02 vs. AUC 0.77 ± 0.02)[5]. C-반응단백질은 SBI 예측에 유용하다. Lacour 등6)은 응급실을 방문한 36개월 이하의 열 환자에서 C-반응단백질의 SBI에 대한 민감도와 특이도를 각각 89%와 75%로 보고했다.
5. 통계적 방법
연속형 변수는 정규분포 여부에 따라 평균 및 표준편차 또는 중앙값 및 사분위수 범위로 표시했으며, 범주형 변수는 수와 백분율로 기재했다. 연속형 변수에 대해서는 Mann-Whitney U test를, 범주형 변수에 대해서는 chi-square test 또는 Fisher exact test를 각각 사용했다.
C-반응단백질과 PRISA 점수 I 및 II 각각의 입원 예측 도구로서 예측성적을 분석하고, PRISA 점수 I 및 II에 C-반응단백질을 결합한 모형의 예측성적과 비교했다. 구체적으로, 입원 예측성적 검증을 위해 백혈구, C-반응단백질, PRISA 점수 I 및 II, SIRS 점수 각각에 대해 receiver operating characteristic (ROC) 곡선을 그린 후 AUC를 계산하여 비교했다. 각 도구의 민감도 및 특이도는 Youden index가 최고인 값을 역치로 하여 구했다. 통계적 분석에는 STATA ver. 12.0 (StataCorp, College Station, TX) 및 MedCalc ver. 18.9 (MedCalc Software BVBA, Ostend, Belgium)를 이용했으며, P < 0.05를 통계적 유의성이 있는 것으로 정의했다.
결과
1. 일반적 특성
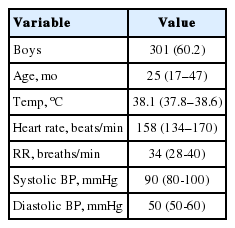
연구기간에 본원 응급실을 방문한 4개월-17세 환자 3,287명 중 열 환자는 1,532명이었다. 여기서 혈액검사를 시행하지 않은 500명을 제외한 총 1,032명을 분석했다. 제외한 500명의 나이의 중앙값은 25개월(사분위수 범위, 17-46.5개월)이었고, 남자가 301명(60.2%)이었으며 체온의 중앙값은 38.1℃ (사분위수 범위, 37.8℃-38.6℃)였다(Appendix 3).
총 1,032명 가운데 입원군은 423명(41.0%)이었다. 입원군에서 나이의 중앙값이 유의하게 높았고(P < 0.001), 성별은 차이가 없었다(Table 1). 감염 병소로는 두 군에서 모두 호흡기 감염이 가장 흔했고, 위장관 감염이 뒤를 이었다(Table 2).
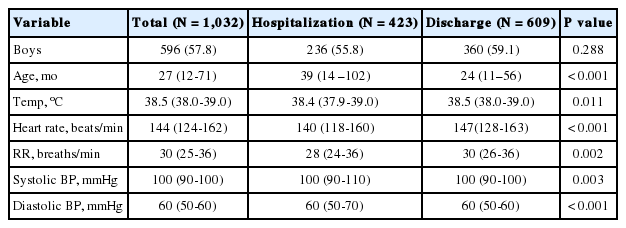
Clinical characteristics of the study population (N = 1,032)
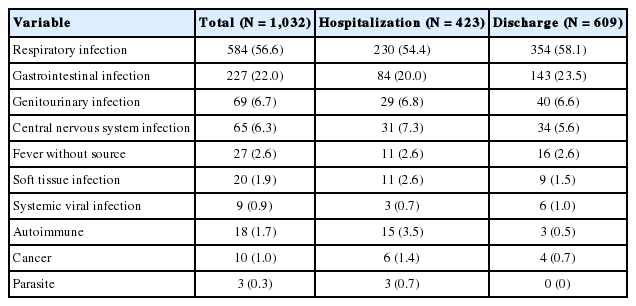
Causes of fever
2. 입원 예측 도구 성적 비교
C-반응단백질, PRISA 점수 I 및 II, SIRS 점수는 입원군에서 유의하게 높았다. 각 단일 도구의 AUC를 비교한 결과, C-반응단백질의 AUC가 0.69 (95% 신뢰구간, 0.66-0.72)로 가장 컸고, 이는 PRISA 점수 I (AUC 0.59; 95% 신뢰구간: 0.56-0.62) 및 II (AUC 0.56; 95% 신뢰구간: 0.53-0.59)보다 우수했다(Table 3, Fig. 1).

Comparison of admission decision support tools between the hospitalization and discharge groups
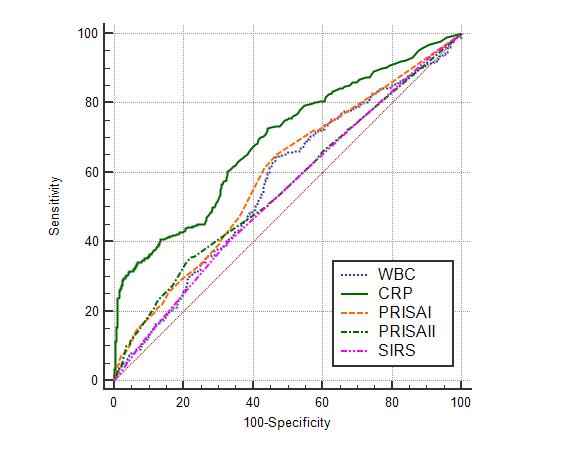
Comparison of area under the curves (AUCs) for hospitalization among the individual admission decision support tools using receiver operating characteristic curves. AUC for white blood cell (WBC), 0.57 (95% confidence interval [CI], 0.54-0.60); for C-reactive protein (CRP), 0.69 (95% CI, 0.66-0.72); for the Pediatric Risk of Admission (PRISA) score I, 0.59 (95% CI, 0.56-0.62); for the PRISA score II: 0.56 (95% CI, 0.53-0.59); and for systemic inflammatory response syndrome (SIRS) score, 0.54 (95% CI, 0.51-0.58).
Youden index를 근거로 산출한 C-반응단백질의 절단값은 34.3 mg/L였고, 이 값에서 민감도 28.8%, 특이도 97.5%였다. PRISA 점수 I은 절단값 15점에서 민감도 29.1%, 특이도 80.4%였고, PRISA 점수 II는 절단값 12점에서 민감도 35.5%, 특이도 78.0%였다(Table 4).
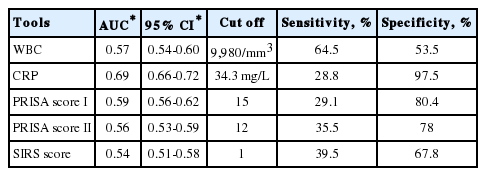
Comparison of AUCs for hospitalization among the individual admission decision support tools
PRISA 점수 I에 C-반응단백질을 결합한 모형의 AUC는 0.71 (95% 신뢰구간: 0.69-0.74)이었고, PRISA 점수 II에 C-반응단백질을 결합한 모형의 AUC는 0.71 (95% 신뢰구간: 0.68-0.74)였다. PRISA 점수 I과 II에 각각 C-반응단백질을 결합한 모형과 C-반응단백질 단독일 때 AUC 크기를 비교해 보면, PRISA 점수 I에 C-반응단백질을 결합한 모형만이 보다 통계적으로 유의하게 AUC를 증가시켰다(P = 0.048, P = 0.054) (Table 5, Fig. 2).
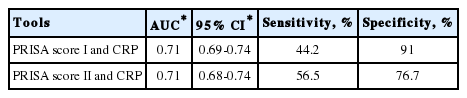
Comparison of AUCs for hospitalization of the 2 combined models of the PRISA scores and CRP
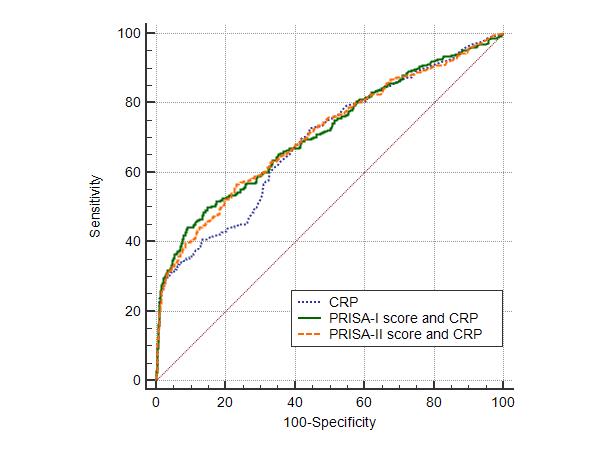
Comparison of area under the curves (AUCs) for hospitalization of isolated C-reactive protein (CRP) and the 2 combined models of the PRISA scores and CRP using receiver operating characteristic curves. AUC for CRP, 0.69 (95% confidence interval [CI], 0.66-0.72); for Pediatric Risk of Admission (PRISA) score I and CRP, 0.71 (95% CI, 0.69-0.74); and for PRISA score II and CRP, 0.71 (95% CI, 0.68-0.74). AUC of combined model of the PRISA score I and CRP vs that of the isolated CRP (P = 0.048) and AUC of combined model of the PRISA score II and CRP versus that of the isolated CRP (P = 0.054).
3. 기타 추적 관찰 결과
연구대상자 중 방문 30일 이내 사망은 없었다. 퇴원군에서 7일 이내 소아청소년과 외래로 재방문한 환자는 25명(4.1%) 모두 입원했다. 응급실로 재방문한 24명(3.9%) 중, 10명이 입원했다.
고찰
본 연구는 소아 열 환자에서 입원 예측 도구의 예측성적을 평가하여, 소아진료 경험이 부족한 의사의 입원 결정을 돕는 것을 목표로 수행했다. PRISA I, II 점수에 C-반응단백질을 결합한 모형의 AUC (0.71)가 단일 도구 중 가장 우수한 C-반응단백질의 AUC (0.69)보다 높았으나, PRISA II 점수에 C-반응단백질을 결합한 모형은 통계적으로 유의하게 AUC를 증가시키지는 않았다. 이는 PRISA I 점수에 C-반응단백질을 결합하는 것이 입원 결정에 유용함을 시사한다.
C-반응단백질을 이용하여 SBI를 예측하는 연구의 결과를 AUC를 중심으로 요약하면 다음과 같다. Pulliam 등[7]은 36개월 이하의 열 환자에서 C-반응단백질의 SBI 예측성적을 70 mg/L를 절단값으로 할 때 민감도 79%, 특이도 91%, AUC 0.91로 보고했다. Isaacman과 Burke[8]가 응급실을 방문한 3-36개월 열 환자에서 C-반응단백질의 잠재 세균혈증(occult bacteremia) 예측성적을 44 mg/L를 절단값으로 할 때 민감도 63%, 특이도 81%, AUC 0.71로 보고했다. Hu 등[9]이 C-반응단백질의 SBI 예측성적을 분석한 체계적 문헌고찰에 따르면, 절단값 8-20 mg/L에서 민감도 69%, 특이도 75%였고, AUC 0.78이었다.
Miles 등[13]은 영국에서 PRISA I 점수의 AUC를 0.76으로 보고했다. Gravel 등[14]은 캐나다에서 응급실을 방문한 소아환자에서 입원 예측성적을 PRISA I 점수를 통하여 전향적으로 분석한 결과, AUC 0.79로 보고했다.
본 연구에서 PRISA I 점수와 PRISA II 점수의 AUC는 이전 타당도 검증에서 보고된 AUC보다 비교적 낮은 것은 다음과 같은 원인에 기인한 것으로 추정한다. 첫째, 본 후향적 연구에서 병력청취 시 PRISA 점수에 필요한 항목이 누락되어 점수가 상대적으로 낮게 측정됐을 수 있다. 둘째, 응급실 퇴원 이후 49명(8%)의 환자가 외래 및 응급실을 통하여 재방문했으며 이 중 39명(71%)이 입원했다. 이는 후향적 데이터로 수집으로 PRISA 점수의 정확도가 영향을 받았음을 시사한다. 셋째, 본 연구에서 입원 결정에 의학적 상태 외에 보호자의 요구가 더 큰 영향을 미친 환자가 일부 포함됐다는 점이다.
본 연구의 제한점은 다음과 같다. 첫째, 총 1,532명의 열 환자 중 500명이 혈액검사 누락으로 제외되어 비뚤림의 가능성이 있다. 둘째, 단일기관에서 시행한 후향적 분석으로 일반화가 어려울 수 있다.
결론적으로, 본 연구에서 응급실을 방문한 소아 열 환자에서 PRISA I score와 C-반응단백질 결합모형을 통해 입원을 효과적으로 예측할 수 있었다. 향후 전향적인 연구가 필요하다고 생각한다.
Notes
이해관계
본 저자는 이 논문과 관련된 이해관계가 없음.
Acknowledgements
본 저자는 이 논문과 관련된 재정지원을 받지 않았음.