Changes in emergency department utilization by neonates during the coronavirus disease 2019 pandemic: a single-center study in Korea
Article information

Abstract
Purpose
: This study describes changes in the utilization pattern of emergency departments (EDs) by neonates during the coronavirus disease 2019 pandemic to ensure efficient resource allocation during future infectious disease outbreaks.
Methods
: We performed a retrospective observational study by reviewing the medical records of neonates (≤ 30 days) who visited the ED. They were divided into pre-pandemic (February 2018-January 2020) and pandemic (February 2020-January 2022) groups. We compared data regarding ED utilization, including length of stay, disposition, and chief complaints.
Results
: A total of 156 neonates visited the ED during the study period. A 42.4% decrease in the visits was observed during the pandemic group (n = 57), compared with the pre-pandemic group (n = 99). In particular, the proportion of visits by neonates aged 7 days or younger has decreased from 14.1% (14/99) to 3.5% (2/57; P = 0.035). The proportion of plain radiography performed and median ED length of stay increased from 36.4% (36/99) to 63.2% (36/57; P = 0.001), and from 66.0 minutes (interquartile range, 42.0-116.0) to 86.0 minutes (59.0-153.0; P = 0.007), respectively. Among the chief complaints, fever, respiratory symptoms, and minor clinical problems increased during the pandemic (29.3% to 36.8%, 11.1% to 14.0%, and 9.1% to 14.0%, respectively).
Conclusion
: The pandemic led to a marked reduction in neonatal ED visits, particularly among those aged 7 days or younger. Increases were noted in the rates of plain radiography performed, fever, respiratory, and minor clinical symptoms, as well as median ED length of stay. EDs should prepare for efficient emergency treatments tailored to neonates.
Introduction
The coronavirus disease 2019 (COVID-19) pandemic was a catastrophic global event that greatly impacted different sectors. In Korea, since the first confirmed case was reported in February 2020, 34,572,554 confirmed cases have been reported, and 35,605 deaths have occurred by August 2023 (1). During the pandemic, a reduction was reported in the number of visits to emergency departments (EDs) by patients of all ages (2-4). Several studies have investigated changes in ED utilization patterns in children during the pandemic, but few studies have specifically analyzed neonatal populations.
Neonates are more vulnerable to health problems, and have different features, compared with older children. The former population may present nonspecific symptoms even with severe illness, rendering parents to bring their babies to EDs with minor symptoms (5,6). We aimed to explore the impact of the COVID-19 pandemic on neonatal visits to the ED. Through understanding the change in their visiting patterns, we sought to obtain information on the efficient allocation of medical resources for future infectious disease outbreaks.
Methods
This study was approved by the institutional review board of National Health Insurance Service Ilsan Hospital with a waiver for informed consent (IRB no. 2022-09-050). We conducted a retrospective observational study at the hospital, a secondary care center in Korea with 850 beds covering the northwestern region of Gyeonggi Province. Before the COVID-19 outbreak, the ED provided care to approximately 10,000 patients younger than 19 years annually. By the Korean government, the hospital was designated as a COVID-19 dedicated treatment hospital during the pandemic. Consequently, the number of general beds for hospitalization was reduced, while that of neonatal intensive care unit (NICU) beds remained the same.
Neonates were defined as aged 30 days or younger because in the hospital, infants of such ages are considered eligible for hospitalization to the NICU. We collected information on the neonates who visited the ED from February 1, 2018 through January 31, 2022. This period was divided into pre-pandemic (February 1, 2018-January 31, 2020) and pandemic (February 1, 2020-January 31, 2022) periods.
We collected the neonates’ information from the medical records. Baseline data included sex, age, gestational age, birth weight, delivery by cesarean section, prior NICU hospitalization, referral from other hospitals, visit at night (22:00-07:00), location before ED visits (home, local obstetrics and gynecology hospitals, and postpartum care centers), and residential area (Goyang, Kimpo, Paju, Incheon, and others). The clinical severity was classified by the Korean Triage and Acuity Scale (KTAS) (7). We additionally defined the higher acuity as KTAS levels 1 and 2 (8,9). Furthermore, we obtained information regarding the implementation of plain radiography or blood tests, ED length of stay, and ED disposition (discharge, left against medical advice, transfer, and hospitalization).
Chief complaints were grouped into 8 categories: fever, gastrointestinal symptoms (diarrhea, vomiting, hematochezia, stool color change, or distended abdomen), respiratory symptoms (cough, dyspnea, tachypnea, retraction, or cyanosis), minor clinical problems (irritability, crying, feeding problems, constipation, or umbilical cord care), jaundice, trauma or injury, neurological symptoms (seizure or seizure-like movement), and others (home delivery, skin rash, scrotal swelling, or epistaxis). The diagnoses were recorded as the codes of the Korean Standard Classification of Diseases and Causes of Death, eighth revision, a modified version based on the International Classification of Diseases, tenth revision. For grouping the main diagnoses, we used the Healthcare Cost and Utilization Project’s Clinical Classification Software Refined, version 2023.1, which was developed as a research tool for analyzing patterns of healthcare in terms of cost, utilization, and outcomes by the Agency for Healthcare Research and Quality, a federal agency within the United States (10).
We used IBM SPSS for Windows ver. 23.0 (IBM Corp.) for data analyses. Because a non-normal distribution was confirmed through the Kolmogorov-Smirnov tests, continuous variables are expressed as medians (interquartile ranges). Categorical variables are expressed as numbers (percentages). The chi-square or Fisher’s exact tests were used for categorical variables to compare differences between the 2 groups, and the Mann-Whitney U-tests were used for continuous variables. Statistical significance was defined as P < 0.05.
Results
The number of neonatal visits to the ED during the pandemic period was 57, which amounted to a 42.4% decrease compared to the equivalent number during the pre-pandemic of 99. During the same period, visits to the ED by patients younger than 19 years decreased by 49.6% (from 19,395 to 9,767).
Table 1 shows the baseline characteristics of the study population during the 2 periods. Although there were no differences between the median ages of the 2 groups, the visits by neonates aged 7 days or younger decreased by 85.7% (from 14 to 2). No differences in the clinical severity were found between the 2 groups, in terms of the proportions of each KTAS level and the higher acuity (Table 2). The proportion of plain radiography performed increased from 36.4% to 63.2%. Of the neonates in the pandemic group, 24 (42.1%) underwent COVID-19 real-time polymerase chain reactions (RT-PCRs), which all turned out to be negative. The median ED length of stay was longer in the pandemic group.

Baseline characteristics of neonates visiting the emergency department

Comparison of emergency department utilization patterns
Fever was the most common chief complaint during both periods, which comprised 29.3% and 36.8% during the pre-pandemic and pandemic periods, respectively (Table 3). The proportions of respiratory symptoms, minor clinical problems, and others as the chief complaints were higher during the pandemic group, compared with during the pre-pandemic group. Table 4 lists the diagnoses. During the pre-pandemic group, the 4 most common diagnoses were “fever (11.1%),” “hemolytic jaundice and perinatal jaundice (10.1%),” “intestinal infection (8.1%),” and “abdominal pain and other digestive/abdomen signs and symptoms (8.1%).” In the other group, they were “fever (14.0%),” “other general signs and symptoms (8.8%),” “bacterial infections (8.8%),” and “urinary tract infections (8.8%).”
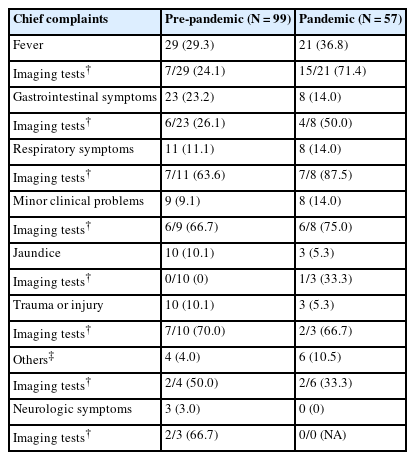
Changes in chief complaints*

Comparison of diagnoses between pre-pandemic and pandemic groups*
Discussion
This study showed that the COVID-19 pandemic had an impact on the number of neonates visiting the ED, with a particularly marked reduction in ED visits for neonates aged 7 days or younger. Most previous studies reported a decrease in patients of all ages visiting EDs (2-4). Visits by children declined further compared to that by adults (4). The reduction in ED utilization was caused by concerns about nosocomial exposure to COVID-19 (3). It is also presumed that the lower severity of COVID-19 in children may have decreased the need for medical utilization (11,12). According to previous studies, the extent of the decline in children’s visits varies across the age groups (13,14). A study in Italy reported that neonatal visits decreased only by 24.4%, doubling the proportion of newborns among all children (from 2.5% to 5.7%) (15). In our study, the decline in neonatal visits was more modest than the ED visits by patients younger than 19 years during the same period. Despite the fear of nosocomial exposure to COVID-19, neonates visited the ED more frequently than older children.
The increase in plain radiography and ED length of stay can be attributed to changes in the institutional screening processes for COVID-19. During the pandemic, emergency practices generally took longer because medical staff had to wear personal protective equipment, such as gowns, caps, and masks. If neonates exhibited suspected symptoms of COVID-19 or had contacted a confirmed person, chest radiography or RT-PCR was probably performed. The RT-PCR usually has a long turn-around time. The medical staff probably used plain radiography on the neonates with fever, a main symptom of COVID-19, more frequently during the pandemic period than they had done before (Table 3).
Our study showed no change in the proportion of higher acuity-related neonatal visits to the ED as well as that of hospitalization. Several other studies have reported an increase in high acuity ED visits and hospitalization rates (15,16). Conversely, some have reported an increase in the proportion of neonates visiting an ED with low acuity diseases (13,14). This discrepancy may be due to the fact that the triage systems in EDs vary among countries, and it is challenging to measure vital signs and perform triage for sick children in EDs (17,18).
We observed an increase in fever and respiratory symptoms as chief complaints during the pandemic period (Table 3). Trauma or injury in neonates decreased in the ED. In contrast, several previous studies analyzing the pediatric population (≤ 18 years) showed that respiratory illness declined, while trauma visits relatively increased during the pandemic (13,14,19). Social distancing and staying at home may have induced changes in the chief complaints of older children and adolescents. However, unlike the population, neonates naturally engage in minimal social activities, and their lifestyles were likely to have remained unchanged during the pandemic. Additionally, fever of neonates is a crucial symptom. While most older children with fever have viral infections, 10%-20% of febrile neonates have serious bacterial infections (20).
The pandemic-related increase was found in the proportion of visits due to minor clinical problems, such as irritability, excessive crying, or feeding problems (Table 3). Among the diagnoses, we noted an increase in the number of “other general signs and symptoms,” which was mainly diagnosed in neonates who visited the ED with minor clinical problems (Table 4). This finding aligns with a previous study that reported a larger proportion of healthy neonates visited the ED for minor conditions during the pandemic period (56.4% in 2019 vs. 81.4% in 2020) (15). Pre-pandemic studies have consistently reported that 44%-70% of neonatal visits are for nonurgent problems, and these nonurgent visits are more related to self-referral than physician-referral (5,6,21). Parents’ insufficient knowledge about benign symptoms of neonates may raise their level of anxiety, leading them to bring their babies to EDs. Social distancing may have prevented obtaining advice from relatives or postpartum caregivers. These preventable ED visits result in inefficient use of healthcare resources (22).
The primary limitation of our study was its retrospective nature, which relied on medical records. Reviewing the records implicates missing information or selection and recall biases. The single-center setting with a small size of the population may limit a generalizability of the study findings. Additionally, because we analyzed the data over the 2-year periods, we were unable to ascertain the impact of social factors, such as changes in the number of confirmed COVID-19 cases and intensity of social distancing.
This study provides insight into the changes in neonatal ED utilization during the COVID-19 pandemic. Neonatal visits decreased with a more conspicuous decline in the visits by those aged 7 days or younger, while increases were observed in the proportion of plain radiography performed and median ED length of stay. Unlike that of older children or adolescents’ visits, the proportion of neonatal visits increased in the fever, respiratory symptoms, and minor clinical problems. Further large-scale studies are needed to deepen our understanding of neonatal ED utilization patterns. Healthcare strategies should be developed to appropriately treat neonates while efficiently distributing emergency resources.
Notes
Author contributions
Conceptualization, Funding acquisition, Project administration, Resources, and Visualization: JH Jin
Data curation, Formal analysis, Investigation, Methodology: SH Lee and JH Jin
Supervision: SW Yoon
Writing-original draft: SH Lee and JH Jin
Writing-review and editing: SW Yoon and JH Jin
All authors read and approved the final manuscript.
Conflicts of interest
No potential conflicts of interest relevant to this article were reported.
Funding sources
This research was supported by the National Health Insurance Service Ilsan Hospital grant (grant no. NIHMC-2022-CR-070).
Data availability
All data presented in this manuscript are available from the corresponding author upon reasonable request.