마스크 착용 의무 해제 이후 응급실 소아 환자의 방문 양상 변화 분석
Change of utilization of emergency department in children after lifting mask mandates in a single center in Korea
Article information

Trans Abstract
Purpose
We aimed to investigate changes in visiting patterns after the lifting of mask mandates in a single pediatric emergency medical center in Seoul, Korea.
Methods
This retrospective study was based on the data of patients’ (≤ 18 years) visits to the emergency department (ED) of the center from January 1, 2022 through June 30, 2023. Clinical characteristics, Korean Triage and Acuity Scale (KTAS) level, ED outcomes, and length of stay were compared between before (March 20-June 30, 2022) and after (March 20-June 30, 2023) the lifting of mask mandates. The comparisons were iterated in the patients with infectious disease.
Results
During the study period, a total of 18,654 children visited the ED. After the lifting of mask mandates, ED visits increased from 7,146 to 11,508 (61.0%; 95% confidence interval, 59.5-62.6; P < 0.001). The increase was more prominent in the age of 2-5 years (82.9%), infectious diseases (175.3%), KTAS level 3 (127.7%), and length of stay shorter than 3 hours (78.8%-92.6%). The number of patients per hour increased by 151.2% for 5 patients or more and over 3,000% for 10 or more. Median length of stay decreased (2.3 hours [interquartile range, 1.2-4.1] to 1.9 hours [1.1-3.5]; P < 0.001). The patients with infectious disease (n = 7,139) showed similar patterns of increase in the age of 2-5 years, KTAS level 3, and length of stay shorter than 3 hours, with an additional increase in the age of 6-18 years.
Conclusion
After the lifting of mask mandates, pediatric visits increased by 61%, with the highest increase in children with mild infectious diseases on weekends and at night, and the proportion of more than 10 visits per hour significantly increased. We need urgent and realistic support measures from health authorities.
서 론
코로나바이러스병-19 범유행에 의해 응급실 방문이 감소했다. 관련된 소아 연구는 상대적으로 적었으나, 감염병 비율이 높은 소아 환자가 범유행의 영향을 가장 많이 받는 환자군으로 보고됐고(1), 한국 소아 환자도 성인보다 1.5배 더 감소했다(2,3). 한국 보건당국은 2020년 11월 13일 마스크 착용 의무 시작 후 코로나바이러스병-19 환자 수가 감소하여, 2022년 4월 18일부터 사회적 거리두기를 해제한 데에 이어서, 2023년 3월 20일 의료기관을 제외하고 대중교통을 포함한 실내 마스크 착용 의무를 전면 해제했다(4-6).
소아 환자는 감염병에 취약하므로, 마스크 착용 의무 해제 후 계절성 바이러스에 노출되면서 그간 감소했던 응급실 방문이 반등할 것으로 추론할 수 있다. 또한 최근 소아 진료 인력 공백으로 심야, 주말, 공휴일에 더 많은 소아 환자가 소아전문응급의료센터와 같이 24시간 소아 진료가 가능한 소수의 응급의료기관으로 몰릴 가능성이 높은데, 이 공백은 당분간 지속 또는 악화할 것 같다(7,8). 이러한 상황에서 마스크 착용 의무 전면 해제 조치 후 단일 소아전문응급의료센터의 환자 방문 양상의 변화를 분석하여, 향후 대응 방안 수립에 도움을 주고자 본 연구를 시행했다.
대상과 방법
2022년 1월 1일-2023년 6월 30일에 단일 소아전문응급의료센터를 방문한 18세 이하 환자를 분석했다. 본 연구의 자료는 환자 이름 및 등록번호 등 개인정보를 미리 제거하는 원내 통계 추출 시스템을 이용하여 얻었으며, 역학적 자료 및 변수를 활용한 후향적 연구로서 임상연구심사위원회의 승인을 받았고, 동의서 취득 의무는 면제됐다(IRB no. S2023-2398-0001).
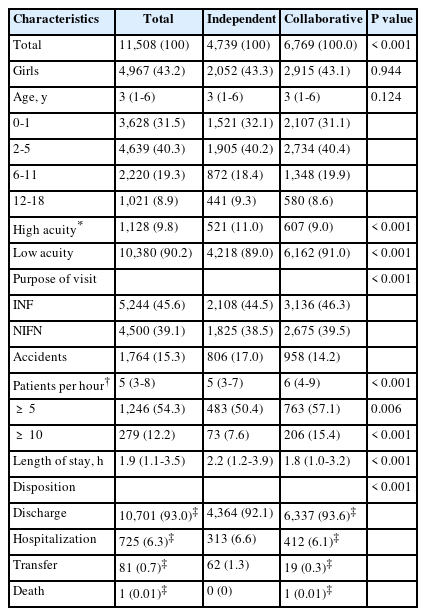
마스크 착용 의무 해제일인 2023년 3월 20일부터 2023년 6월 30일까지를 마스크 해제 후 기간(mask-off)으로, 전년도 같은 기간을 마스크 해제 전 기간(mask-on)으로 각각 정의했다. 2023년 3월 1일부터 전공의 인력 부족으로 08:00-19:00에 전문의 1명이 단독으로 진료했다. 이 상황에서 2023년 4월 29일-6월 30일에는 환자 방문이 많을 것으로 예상되는 주말 및 공휴일 13:00-21:00에 전담 전문의 2명이 동시에 진료했다. 이에 따라 마스크 해제 후 기간 중 2023년 3월 20일-4월 28일을 1인 근무 기간(independent)으로, 2023년 4월 29일-6월 30일을 2인 근무 기간(collaborative)으로 각각 정의하여, 두 군 간 방문 환자의 특성을 추가로 비교했다. 전체 연구기간 동안 전체 근무 전담의 수는 그대로였다.
연구대상자의 나이, 성별, 중증도, 방문 사유(감염병, 비[非] 감염병, 질병 외), 방문 시간대 및 요일, 근무 교대(주간[07:00-15:00], 야간[15:00-23:00], 심야[23:00-07:00]), 진료 결과(귀가, 입원, 전원, 사망), 체류시간, 시간당 방문 환자 수를 분석했다. 나이는 0-1세, 2-5세, 6-11세, 12-18세로 분류했다(9). 최초 중증도 분류는 교육을 이수한 간호사가 한국형 응급환자 분류도구(Korean Triage and Acuity Scale, KTAS)를 사용하여 5단계로 분류했고, 1-2단계를 중증으로 정의했다(10,11). 방문 사유 중 감염병은 열 또는 호흡기 증상이 있거나 주 진단이 국제질병분류 10판에 따른 감염병 코드인 경우로 정의했다. 이를 제외한 증상 또는 주 진단 코드를 비 감염병으로 정의했고, 질병 외는 외상, 중독, 이물 등 사고로 방문한 모든 경우를 포함했다.
마스크 해제 전후 응급실 방문 수의 차이를 해제 전 기준 기간 방문 수로 나누어 변수별 증가율(percent increase) 및 95% 신뢰구간을 제시하고, 각 변수의 증가율을 전체 환자의 증가율로 나누어 증가비(ratio)를 계산했다. 이 과정을 소아가 취약한 감염병 환자만을 대상으로 반복했는데, 이때 증가비는 동일한 변수의 전체 환자 대상 비교에서 구한 증가율로 나누어 계산했다. 범주형 변수는 빈도 및 백분율로, 연속형 변수는 중앙값 및 사분위수 범위로 각각 표기했다. 각 군 간 차이를 비교하기 위해 범주형 변수는 피어슨 카이 제곱 검정을, 연속형 변수는 Mann-Whitney U 검정을 각각 사용했다. 통계분석은 IBM SPSS ver. 26 (IBM Corp.)을 사용했고, 통계적 유의성은 P < 0.05으로 정의했다.
결 과
1. 연구대상자 선정
2022년 3월-2022년 6월에 방문한 8,503명 및 2023년 3월-2023년 6월에 방문한 13,246명을 합친 21,749명 중, 진료 외 목적으로 방문한 3,095명을 제외한 18,654명을 분석했다(Fig. 1).
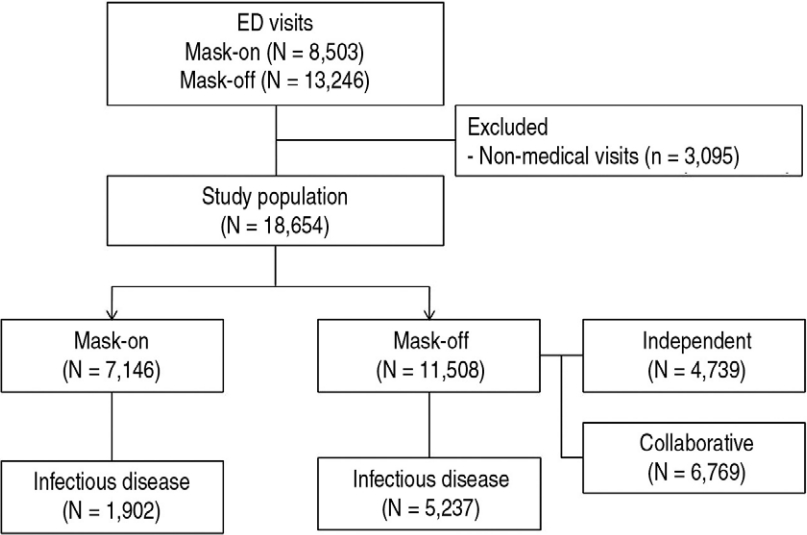
Enrollment of the study population. The mask-on and mask-off periods were defined as from March 20, 2022 to June 30, 2022 and from March 20, 2023 to June 30, 2023, respectively. ED, emergency department.
2. 전체 방문 환자 수 특성
사회적 거리두기를 해제한 2022년 4월을 기준으로, 마스크 해제 후 기간에 월별 방문 환자 수는 최대 2배 증가했다(Fig. 2A). 일별 방문 환자 수는 2022년 4월 18일 사회적 거리두기 해제 이후 증가하기 시작했는데, 2023년 3월 20일 마스크 착용 의무 해제 이후 더 급격히 증가했다(Fig. 2B).
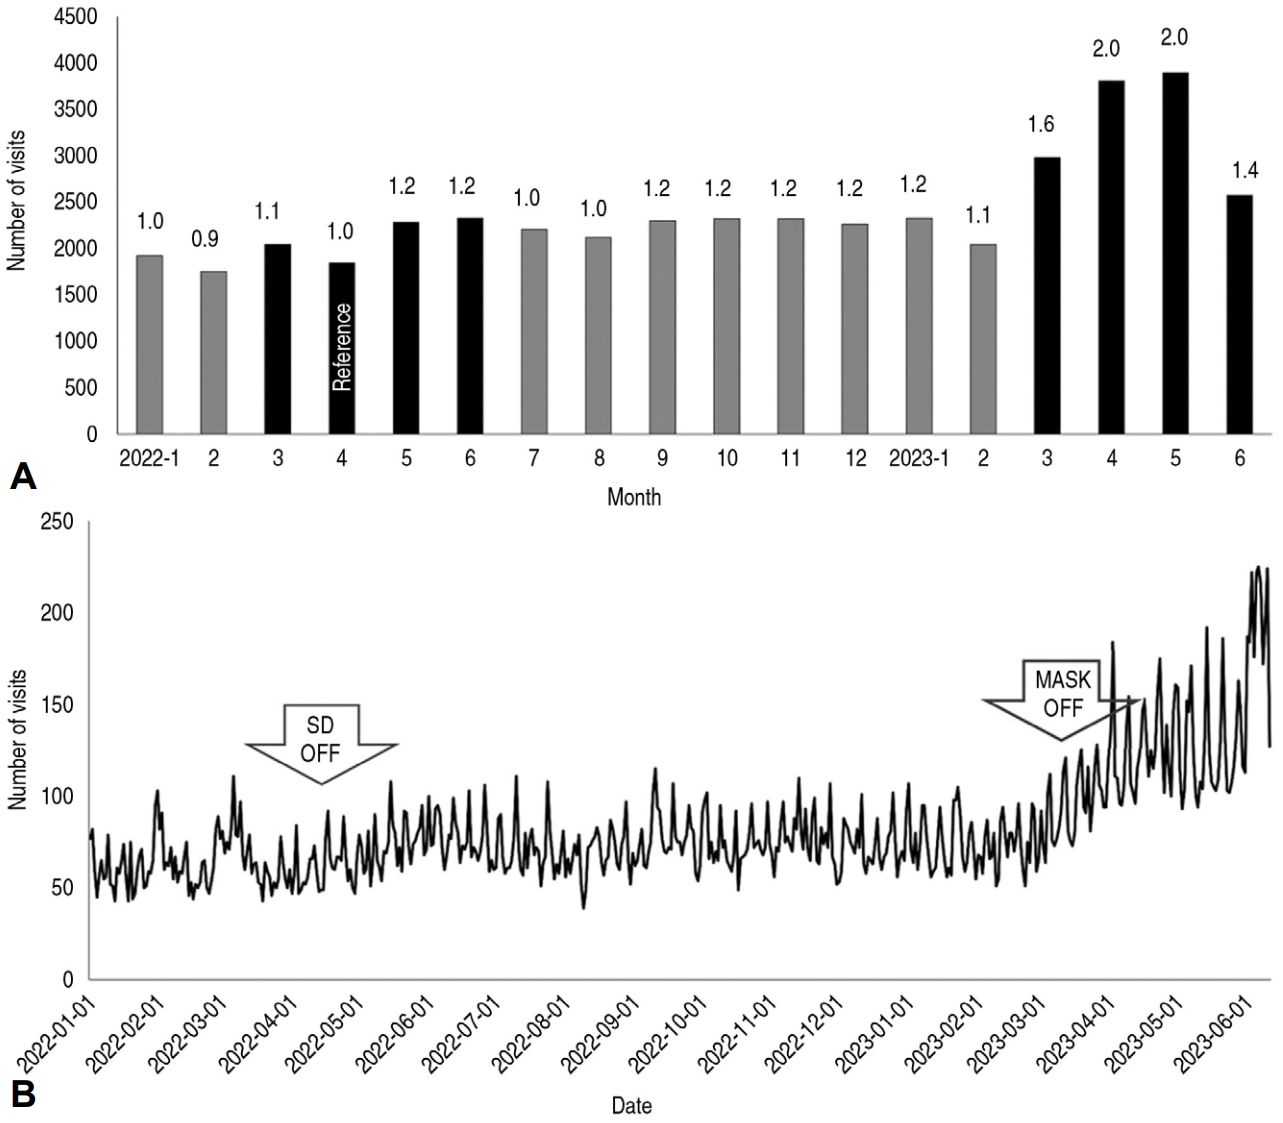
Monthly and daily trends of emergency department visits. (A) The black columns on the left and right represent the mask-on and mask-off periods, respectively. The number above each column indicates the ratio of the number of monthly visits to that in April 2022 (“reference”), the month of lifting SD. (B) Daily visits started to incrase after lifting SD (first arrow). The increase became prominent during the mask-off periods (after the second arrow). SD: social distancing.
3. 마스크 해제 전후 전체 방문 환자의 특성 비교
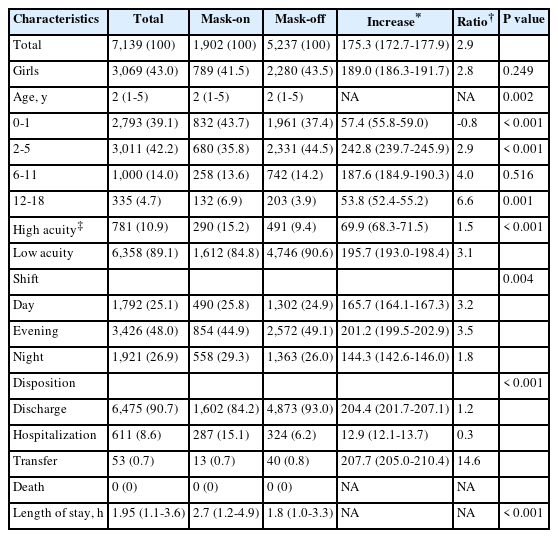
마스크 해제 전후 증가율이 61%였다(Table 1). 나이대 면에서 2-5세의 증가율이 가장 높았다. 최초 중증도 중 3단계 환자의 증가율이 가장 높았고, 4-5단계의 환자는 감소했으며(Appendix 1, https://doi.org/10.22470/pemj.2023.00871), 전체 경증(3-5단계) 비율이 증가했다. 근무 교대 면에서 심야 방문 환자의 증가율이 가장 높았다. 요일별로 일요일 방문이 가장 많았으나, 증가율은 금, 토요일에 가장 높았다. 방문 사유 중 감염병의 증가율이 가장 높았으며, 질병 외 원인은 감소했다. 진료 결과 중 귀가 및 전원 환자가 증가했으나, 입원 환자 비율은 9.6%에서 6.0%로 감소했다. 시간당 방문 환자 수는 마스크 해제 후 중앙값, 시간당 5명 이상 및 시간당 10명 이상 비율이 모두 증가했다. 중앙값 기준 응급실 체류시간은 감소했으며, 1시간 이내 체류한 환자의 증가율이 가장 높았다(Appendix 2, https://doi.org/10.22470/pemj.2023.00871).

Comparison between groups before and after lifting mask mandates
3. 마스크 해제 전후 감염병 환자의 특성 비교
감염병 환자의 증가비는 2.9였다(Table 2). 2-5세의 증가율이 가장 높았으나, 증가비는 6-11세와 12-18세에서 더 높았다. 초기 중증도 중 3단계 환자의 증가율이 가장 높았고, 5단계의 증가비가 가장 높았지만 실제 증가한 방문 환자 수는 4명이었다(Appendix 1). 근무 교대 면에서 야간 방문 환자의 증가율이 가장 높았다. 진료 결과 중 귀가 및 전원 환자 비율이 증가했다. 3시간 미만 체류한 환자의 증가율 및 증가비가 가장 높았다(Appendix 2).
Comparison between groups of children with infectious diseases
고 찰
본 저자가 아는 한, 본 연구는 한국의 소아 진료 인력 공백 상황에서 마스크 착용 의무 전면 해제 후 소아 환자 방문 양상을 최초로 분석한 연구로서, 해제 이후 소아 환자의 응급실 방문이 61% 증가했고, 특히 심야, 주말, 공휴일에, 2-5세, 감염병, KTAS 3단계 환자에서 진료 후 귀가의 증가율이 현저하게 높다는 점을 드러냈다. 따라서, 경증 감염병 환자 방문으로 인해 심야, 주말, 공휴일 방문 및 응급실 혼잡도가 증가한 것으로 추론할 수 있다. 특히 응급실 환자 안전에 심각한 영향을 미칠 수 있는 시간당 10명 이상 방문이 많이 증가했는데(Table 1), 본 연구에서 전문의 동시 근무로 응급실 체류시간 감소 등 긍정적 효과를 확인했다. 본 연구를 토대로, 응급실 소아 진료에 참여하는 의사들이 병원 경영진 또는 보건 당국에 적극적이고 현실적인 지원 대책을 요구할 수 있을 것으로 기대한다.
환자 수 증가에도 불구하고 응급실 체류시간 및 입원 비율이 감소한 것은 코로나바이러스병-19 범유행에 의해 체류시간이 늘어났다가 회복되는 것에 기인한 것으로 볼 수 있으며, 그 근거는 다음과 같다. 첫째, 상기 감염병 관련 선별검사 및 진료 전 일반방사선영상 촬영 등 절차가 없어졌다. 둘째, 의료기관 방문에 따른 감염 위험에 대한 보호자의 불안이 줄었다. 셋째, 증가한 감염병 환자의 중증도가 낮아 진료 후 바로 귀가하는 환자가 많았다. 넷째, 2023년 4월 29일 이후 전문의 2명 동시 진료의 효과가 반영됐을 수 있다.
한국 연구에서 코로나바이러스병-19 범유행 시 응급실 체류시간 및 입원 비율이 증가하고 소아 환자 방문이 47.6%-68.8% 감소했다(3,11-13). 소아 방문 감소는 주로 응급실에서 감염 전파 우려 및 사회적 거리두기 자체의 효과로 생각되고(14-16), 주로 호흡기 및 위장관 감염 비율이 감소하는 것으로 한국 및 미국 연구에서 보고됐다(3,17). 더불어 상대적으로 전체 손상 환자 비율이 증가했으나(3), 손상 환자 증감에 대한 결과는 사회적 거리두기 자체로 인한 스포츠 활동 감소 및 높은 가정 내 손상 발생 빈도 등의 전체 손상 비율에 대한 기여도와 그에 영향을 미치는 나이대 등 조건에 따라 달라질 수 있다(14,18). 본 연구에서는 마스크 착용 의무 해제 이후 손상 비율이 감소하는 것을 관찰할 수 있으며, 이는 감염병 비율이 높은 것과 연관이 있다고 추정한다.
전문의 2인 근무 기간에 시간당 방문 환자 수가 더 많았음에도 응급실 체류시간이 감소한 것은 마스크 착용 의무 해제 후 기간에 나타난 현상이므로, 2인 근무 효과 자체에 추가로 주말 및 공휴일에 경증 환자 비율이 높은 것도 원인으로 생각된다. 본 연구에서 2인 근무는 주말 및 공휴일 일부 시간대에 시행한 것으로, 인력 추가 확보 후 2인 근무를 평일 및 전체 시간대로 확대하면 그 효과가 더욱 두드러질 것으로 추정한다.
병원별 응급실 방문 횟수는 소아응급진료 전담의 유무에 따라 달라질 수 있어서, 본원 근처 의료기관의 소아응급환자 진료 및 수용 능력이 본 연구 결과에 영향을 미쳤을 수 있다. 또한, 연구기간에 본원 주변에서 24시간 진료할 수 있는 2, 3차 병원 응급실을 개원 또는 폐쇄한 사례는 없었으나, 전국적으로 환자 이송 및 119 연락을 받는 본원 소아전문응급의료센터와 최근 악화한 한국 소아 진료 인력 공백도 영향을 미쳤을 것이다. 다만, 본 연구에서 마스크 착용 의무 해제 효과와 진료 공백 효과를 구분하여 정량화하지는 못했다. 해제 전후 감염병 환자만을 대상으로 비교 시, 전체 환자의 증가율보다 두드러지게 높아 증가비가 높게 나왔던 6세 이상, KTAS 5단계, 야간 방문 등 변수에 대해서는 해제 효과가 더 컸을 수 있다. 하지만, 이 경우에도 경증 감염병 환자 방문이 진료 공백의 영향을 불가피하게 받음을 고려해야 한다. 본 연구에서 전체 소아 환자 증가율은 61%였으나 시간당 방문 환자 수가 10명 이상인 빈도가 30배로 증가했는데, 이 경우 일시적 재난 상황처럼 응급실 안전을 저해할 수 있어 개선이 필요하다. 이러한 개선 필요성은 마스크 착용 의무 해제 후 KTAS 1 단계 방문도 71.4%가 증가했기에(증가비 1.2) 더 강조해야 한다(Appendix 1). 단기적으로는 본 연구처럼 전문의 인력을 확충하여 동시 근무로 응급실 체류시간을 줄이고 안전성을 높이는 것이 하나의 해결책이 될 수 있다. 장기적으로는 보건 당국이 소아 및 심야, 주말, 공휴일 의료수가를 현실화함으로써, 경증 감염병 환자의 진료 인프라를 확충해야 한다.
과거에는 응급실 소아 진료는 소아청소년과 전공의 인력에 의존했다. 2010년 장중첩증 환자 사망 이후 보건복지부가 소아전용 응급실 사업을 시행했지만, 응급진료는 전공의 담당이라는 인식이 개선되지 않고 소아응급진료 전담 전문의를 위한 근무 조건 또는 보상 등에 대한 보건 당국의 개선 조치가 미흡하여 응급실 소아 진료에 참여할 전문의를 채용하기 어려웠다(7). 소아전문응급의료센터 사업 이후에도 이러한 문제는 지속했고(19), 2020년부터 일부 대학병원 응급실의 소아 진료 또는 입원이 어려운 지경으로 악화했다. 이 상황에서 코로나바이러스병-19로 소아 진료와 관련된 경영난이 겹치면서, 2019년부터 소아청소년과 지원율이 감소하여 2023년에는 25.5%(53명 지원/208명 정원)에 불과했다(20). 전공의 인력 부족은 전문의로 보완해야 하는데, 소아응급진료 전담 전문의의 심야, 주말, 공휴일이 포함된 주당 근무시간을 30시간 이내라고 가정하면, 전공의 1명이 부족할 때마다 전문의 2-3명이 필요할 것으로 추산할 수 있다.
본 연구의 제한점은 다음과 같다. 첫째, 단일기관 후향적 연구이다. 둘째, 마스크 착용 의무 해제 효과와 소아 진료 인력 공백 효과를 정량적으로 분석하지 못했다. 셋째, 표본 크기가 커서 1종 오류가 발생할 수 있다. 예를 들어, Table 3의 중증 빈도 또는 진료 결과는 통계적 유의성이 있지만 실제 백분율 차이의 임상적 유의성에 관해서는 논란이 있을 수 있다.
본 연구를 통해 마스크 착용 의무 해제 이후 소아 환자 방문이 61% 증가했고, 심야, 주말, 공휴일에 경증 감염병 환자의 증가가 현저했는데, 시간당 방문 환자 수의 급증으로 인해 응급실 환자 안전이 악화할 수 있다. 이 문제에 대한 보건 당국의 적극적이고 현실적인 대책이 필요하다.
Notes
Conflicts of interest
No potential conflicts of interest relevant to this article were reported.
Funding sources
No funding source relevant to this article was reported.
Author contributions
Conceptualization: JM Ryu
Data curation: C Shin, JS Park, D Kim, MK Chun, and J Han
Formal analysis: C Shin and JM Ryu
Investigation and Methodology: HR Cho, H Jang, JS Lee, and JM Ryu
Project administration: JS Park, D Kim, and JM Ryu
Software: JS Park, D Kim, MK Chun, and J Han
Supervision: JS Lee and JM Ryu
Writing-original draft: C Shin, JS Park, D Kim, MK Chun, J Han, and JM Ryu
Writing-review and editing: HR Cho, H Jang, JS Lee, and JM Ryu
All authors read and approved the final manuscript.
Data availability
All data presented in this manuscript is available from the corresponding author upon reasonable request.

