코로나바이러스감염증-19 범유행이 소아 환자의 응급실 방문에 미치는 영향
Effect of coronavirus disease 2019 pandemic on children’s visits to the emergency department
Article information

Trans Abstract
Purpose
In the coronavirus disease 2019 pandemic, it is essential to supplement the changes in visiting patterns of individual emergency departments (EDs) to determine how to allocate emergency medicine resources. We compared the clinical features of children visiting the ED before and during the pandemic.
Methods
Children younger than 18 years who visited the ED from February 2019 through December 2020, except January 2020, were enrolled, and divided into those who visited before and after January 2020 (the pre-pandemic and pandemic groups, respectively). We compared the 2 groups in terms of the baseline characteristics (age, sex, mode and route of arrival, cause of visit, and time of visit), chief complaint, ED diagnosis, initial acuity and its accuracy, and ED outcomes (length of stay and disposition).
Results
The 31,036 children were categorized into the pre-pandemic (21,027 [67.8%]) and pandemic (10,009 [32.2%]) groups with a 52.4% decrease in the number of visits to the ED in the latter group. This decrease was more prominent in age 2-5 years (from 37.3% to 33.2%; P < 0.001), fever as a chief complaint (from 27.8% to 16.5%), diagnoses related to infection or the respiratory system (from 36.8% to 14.3%) or transfer to the ED (from 8.1% to 6.4%; P < 0.001). In contrast, increases were noted in age 12-17 years (from 14.9% to 17.4%; P < 0.001), injury (from 36.5% to 52.5%; P < 0.001), visits in the evening (from 54.9% to 57.4%; P < 0.001), length of stay longer than 6 hours (from 3.5% to 6.3%; P = 0.033), and low acuity (from 97.8% to 98.2%; P = 0.031).
Conclusion
The pandemic has brought about changes in visiting patterns of the ED. This study may help prepare strategies for the appropriate allocation and deployment of emergency medicine resources in the pandemic era.
Introduction
Coronavirus disease 2019 (COVID-19) pandemic has resulted in 54.2%-60.0% decreases in children’s visits to emergency departments (EDs)1-4). Despite this decreasing trend of the visits, ED-based protection system for the disease incurred an increase in workload of relevant personnel. It is essential to supplement the change in visiting pattern of an individual ED to determine how to allocate emergency medicine resources. We compared the clinical characteristics of children visiting the ED before and during the pandemic for 22 months.
Methods
1. Study design and patient selection
We conducted this study at the ED of an urban academic tertiary-care hospital in Korea. This 900-bed facility, a regional emergency medical center designated by the government, had approximately 75,000 annual visits to the ED, including more than 20,000 children’s visits during the pre-pandemic period. The hospital is the regional central hospital providing medical services for 1,000,000 people in the surrounding 4 cities: Anyang, Gwacheon, Uiwang, and Gunpo. It has pediatricians responsible for emergency care 24 hours a day. This study was approved by the institutional review board of Hallym University Sacred Heart Hospital with a waiver for informed consents (IRB no. 2021-06-027).
Study population was selected through a review of medical records. All children younger than 18 years who visited the ED from February 1, 2019 through December 31, 2020 were included. This population was divided into the pre-pandemic (February-December 2019) and pandemic (February-December 2020) groups according to the point of visits. January 2020 was excluded because in Korea, the first confirmed case of COVID-19 was announced on January 20, 2020, and the first epidemic started in February 20205). Children who had missing medical records or visited for purposes other than medical treatment were excluded. If 2 or more visits occurred within the period, each visit was separately included.
2. Data collection
We obtained data regarding the following baseline characteristics: age (year), age group (0-1, 2-5, 6-11 and 12-17 years), sex, mode (walk-in, and public and private ambulances) and route of arrival (direct, transfer, and via outpatient department), cause of visit (injury and disease), and time of visit (day [08:00-16:00], evening [16:00-24:00], and night [24:00-08:00 on the following day]), chief complaint, ED diagnosis, initial acuity and its accuracy by the Korean Triage and Acuity Scale (KTAS)6), and ED outcomes (length of stay [LOS] and its intervals [0-3-6 hours] and disposition [discharge, ward, intensive care unit, transfer, discharge against medical advice, and death]). The diagnosis was recorded using codes of the Korean Standard Classification of Diseases and Causes of Death, 8th revision7). If 2 or more codes were assigned to a child, we chose 1 code that was clinically most relevant. The KTAS levels were divided into the high (levels 1-2) and low (levels 3-5) acuity. Under-triage was defined if a follow-up KTAS level was higher than the initial level, and over-triage is defined as the opposite.
3. Statistical analyses
The normality of the data distributions was evaluated using the Kolmogorov-Smirnov tests for the selection of appropriate parametric and non-parametric statistical methods. Categorical variables were expressed as total numbers (percentages), and analyzed using the chi-square or Fisher exact tests. Continuous variables were expressed as medians (interquartile ranges), and analyzed using the Mann-Whitney U-tests. For all comparisons, the tests were 2-tailed and between-group differences were considered significant at P < 0.05. Statistical Package for the Social Sciences for Windows ver. 18.0.0 (SPSS Inc., Chicago, IL) was used for the analyses.
Results
The study population (n = 31,036) was categorized into the pre-pandemic (21,027 [67.8%]) and pandemic (10,009 [32.2%]) groups (Table 1). No children were excluded. Fig. 1 shows the impact of COVID-19 on the monthly number of ED visits. In both groups, the median age was 4 years, but 75 percentiles increased from 8 to 9 years. The proportions of age 2-5 years decreased from 37.3% to 33.2%, while that of age 12-17 years increased from 14.9% to 17.4%. The ratio of transfer decreased from 8.1% to 6.4%, while the ratio of injury and evening visit increased from 36.5% to 52.5% and from 54.9% to 57.4%.

Baseline characteristics
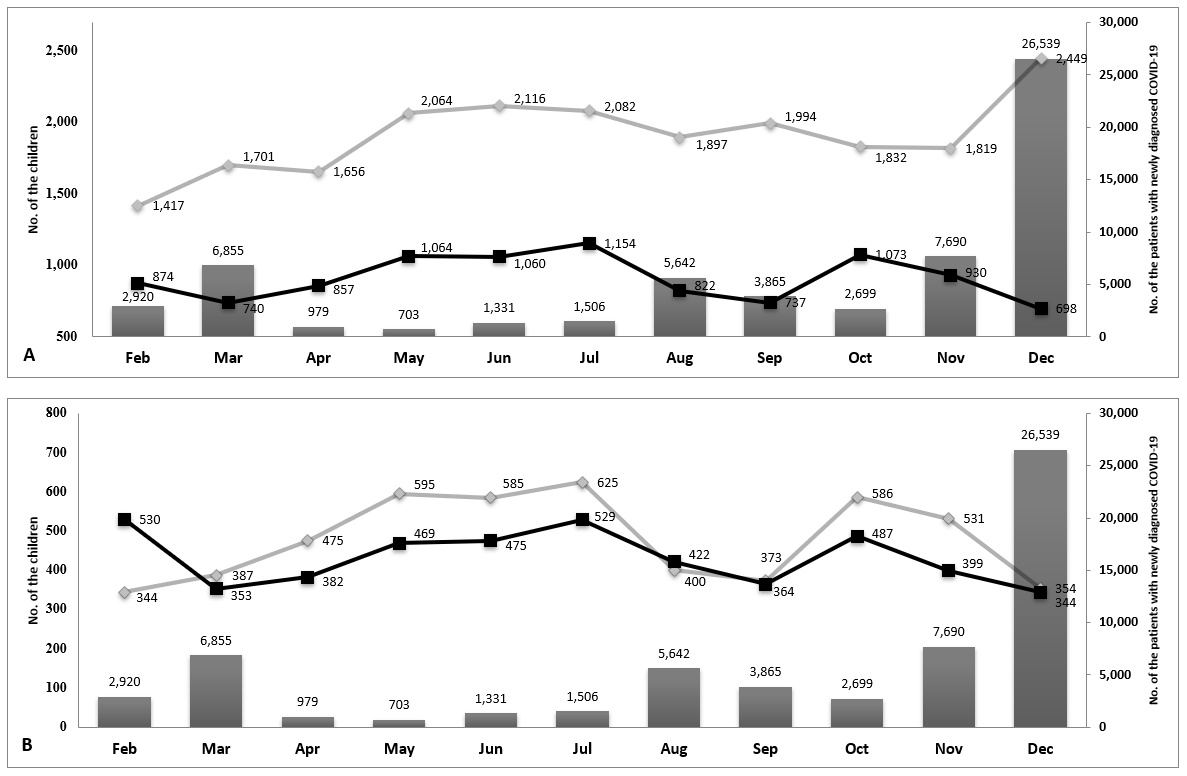
Monthly trend of visits to the ED in 2020. Bars indicate the monthly numbers of patients, including adults, with newly diagnosed COVID-19 in Korea. Gray and black lines respectively indicate the monthly numbers of children who visited the ED in 2019 and in 2020 (A). Gray and black lines respectively indicate the monthly numbers of children with disease and with injury who visited the ED (B). COVID-19: coronavirus disease 2019, ED: emergency department.
Tables 2 and 3 show increases in facial and limb injuries as chief complaints (from 28.6% to 41.2%) and in the “Injury, poisoning, and certain other consequences of external causes (S00-S99, T00-98)” as diagnoses (from 34.5% to 52.2%). Conversely, decreases were found in fever as a chief complaint (from 27.8% to 16.5%) and in the “Diseases of the respiratory system (J00-J99)” and “Certain infections and parasitic diseases (A00-B99)” as diagnoses (from 36.8% to 14.3%).
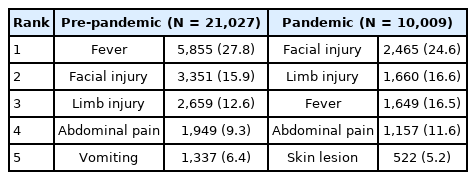
Top 5 chief complaints
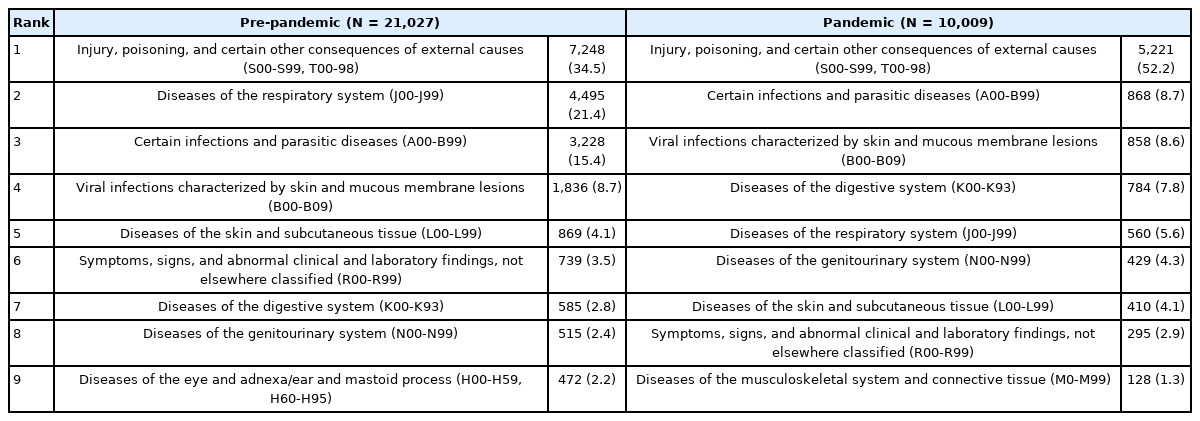
Top 9 emergency department diagnoses as per the diagnostic codes of the Korean Standard Classification of Diseases and Causes of Death, 8th revision
As shown in Table 4, there was a significant difference in the initial KTAS level between the pre- and pandemic groups. The proportion of low acuity minimally increased from 97.8% to 98.2%, especially in KTAS 4 from 47.9% to 57.8%. The accuracy of initial acuity was not different between the 2 groups. Between injury and disease, only disease showed a significant difference in composition of the KTAS levels between the 2 groups (Appendices 1 and 2, https://doi.org/10.22470/pemj.2021.00381).
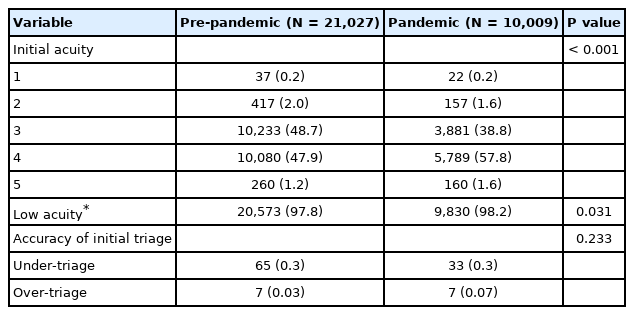
Initial acuity and accuracy by the Korean Triage and Acuity Scale
Table 5 demonstrates the significant difference in the ED outcomes between the pre-pandemic and pandemic groups. Compared with the former group, the latter’s median LOS decreased from 97 to 87 minutes, while their proportion of staying for longer than 6 hours increased from 3.5% to 6.3%. As for the disposition, the percentages of discharge and hospitalization to the ward decreased in the pandemic group.
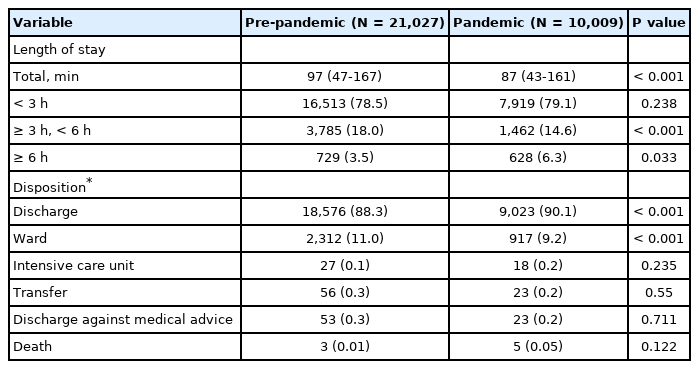
Emergency department outcomes
Discussion
This study has the following implications. First, during the COVID-19 pandemic period, there was a 52.4% decrease in the number of children’s visits to the ED. This decrease was more prominent in the children who were aged 2-5 years, had fever as a chief complaint or diagnoses related to infection or the respiratory system or were transferred to the ED. Second, despite this decreasing trend, there were increases in the children who were aged 12-17 years, had injury, and visited in the evening. Third, the changes in most outcomes were clinically minimal despite the reported statistical significance except the increases in the emergency department LOS longer than 6 hours, KTAS 4, and low acuity.
The 52.4% decrease reported in this study approximates to the previously reported COVID-19 pandemic-related decrease in the visits to EDs ranging from 54.2% to 60.0%1-4). This decrease might be related to the guardians’ concern about the nosocomial exposure to severe acute respiratory syndrome-coronavirus 2. This hesitation to visit EDs can be strengthened by healthcare providers’ concerns about the pandemic8). A German study reported that the fear of contracting COVID-19 was a major cause of the decline in ED visits among children9). The trough of non-COVID-19 visits to 2 Italian EDs corresponded to the peak of daily COVID-19 mortality trend10). Along with the Italian study, our findings suggest ambivalent implications; overuse by non-emergency children and delayed consultations with relevant specialists.
Our study shows the increase in proportion of low acuity, which is contradictory to situations in the pandemic. We found a disproportionate decrease in disease-related visits (e.g., fever). A similar trend was observed in a United States study on children’s visits to 148 EDs during the COVID-19 pandemic11). Fig. 1 shows a wider range of change in disease-related visits than that in injury-related ones as per the monthly trend of newly diagnosed COVID-19 in Korea. Appendices 1 and 2 show that in context of more prominent decrease in disease-related visits, the parallel decreases in the absolute values of the KTAS 4 children with injury and with disease (2,190 and 2,101, respectively) resulted in the overall increase in proportion of KTAS 4.
During the pandemic, emergency practice for children with fever or respiratory symptoms is conducted in an isolated area. This spatial limitation rendered the ED difficult to accommodate children with such symptoms, as shown by the decrease in transfer to the ED (Table 1). This difficulty is exemplified by the decreases in visits for fever and the diagnostic codes related to infection or the respiratory system (Tables 2, 3). This change in the codes is consistent with the corresponding changes in a recent Korean study2).
The proportions of LOS for shorter than 3 hours and for 6 hours or longer in the pandemic group tended to increase compared to the pre-pandemic group. For hospitalization in the pandemic era, children need negative results of COVID-19 regardless of the presence of fever or respiratory symptoms. Time required for this process might affect the increase in the proportion of LOS for 6 hours or longer.
Our study has several limitations. First, its single-center, retrospective design might lead to selection bias. Second, only children who visited the ED during the study period were analyzed without a sample size calculation. Third, the diagnostic codes assigned by clinicians might incur misclassification bias. Finally, compared to other studies3,11), our study showed a higher proportion of injury. This flaw was possibly owing to a lack of emergency care facility for injured children other than the ED.
In conclusion, the number of children visiting the ED has decreased since the onset of pandemic, particularly, in the proportions of age 2-5 years, visits for fever or respiratory symptoms, and transfer to the ED. The pandemic has brought the ED the changes in visiting patterns. This study may help prepare strategies for the appropriate allocation and deployment of emergency medicine resources in the pandemic era.
Notes
Conflicts of interest
No potential conflicts of interest relevant to this article were reported.
Funding sources
No funding source relevant to this article was reported.
References
Appendices
Initial acuity of the children with injury*

