| Home | E-Submission | Sitemap | Contact us |  
top_img
Pediatric Emergency Medicine Journal > Volume 11(1); 2024 > Article
Nagelkerke, Zagten, Sprij, Bekhof, Veen, and Kruizinga: Incidence, severity, and clinical characteristics of lower respiratory tract infections in children before and after the coronavirus disease 2019 lockdown: a Dutch single-center study

Abstract

Purpose

Coronavirus disease 2019 (COVID-19) public health measures reduced the incidence of pediatric lower respiratory tract infections (LRTIs) in 2020. An inter-seasonal surge in the LRTI has occurred after relaxation of restrictions. We aimed to compare characteristics and disease severity of children with LRTI before, during, and after COVID-19 lockdown.

Methods

All LRTI-related visits to emergency department (ED) of a large pediatric hospital in the Netherlands between 2019 and 2021 were included. Variables were compared between 2019 and 2020, and between 2019 and 2021, respectively. The variables included demographic characteristics, condition upon ED arrival, diagnosis, applied treatment, and follow-up.

Results

In 2019, 2020, and 2021, numbers of the visits were 573, 280, and 519, respectively, comprising the study population (n = 1,372). In 2020, the patients were older, and showed higher frequencies of preterm birth history, co-occurring symptoms of obstructive lung disease, and salbutamol therapy in the ED, than in 2019. In 2021, the patients were younger, showed higher frequencies of desaturation, bronchiolitis, co-occurring symptoms of obstructive lung disease, salbutamol therapy, and hospitalization, and showed lower frequencies of respiratory ED visits or hospitalization in the past year, and antibiotic therapy. During hospitalization in 2020, the patients were older, and showed shorter duration of oxygen support and length of hospital stay, as well as lower frequencies of nasogastric tube insertion, compared to 2019. In 2021, compared to 2019, the patients showed a higher frequency of bronchiolitis and lower frequencies of underlying medical conditions and antibiotic therapy.

Conclusion

The children presenting with LRTIs in 2021 seem to have had a more severe clinical phenotype, possibly explained by immunity debt after the COVID-19 lockdown, stricter referral policy, or changes in healthcare-seeking behavior. Future research is needed to evaluate the long-term consequences of growing up during the lockdown.

Introduction

Historically, pediatric lower respiratory tract infections (LRTIs) follow a predictable seasonal pattern with peak incidences between late fall and early spring and lower incidences in warmer months (1-5). In 2019, severe acute respiratory syndrome coronavirus 2 developed into the coronavirus disease 2019 (COVID-19) pandemic (6). Public health restrictions were enforced globally in an attempt to slow down rising infection rates (7-9). Such restrictions controlled COVID-19, and reduced the incidence of other infections (10-14). Pediatric respiratory infection rates were remarkably low in 2020, as the traditional winter epidemics were absent from both hemispheres (15-22). An unusual inter-seasonal surge in pediatric LRTIs has been seen in many countries following the relaxation of COVID-19 restrictions (23-30). A possible explanation for these unusual summer epidemics is called “immunity debt,” a term proposed to describe the lack of immunity in a population caused by extended periods of low pathogen exposure (31,32).
This proposed mechanism raises the question if children infected during the summer epidemic were more prone to serious disease, leading to more severe clinical presentation. Results of previous studies suggest similar disease severity compared to pre-pandemic seasons, with 1 study reporting a higher severity (23,25-27,29,30,33,34). Previous studies have focused mainly on respiratory syncytial virus (RSV), not considering other viral LRTIs. The aim of this study was to compare characteristics and disease severity of children with LRTI before, during, and after the COVID-19 lockdown.

Methods

1. Study design, population, and ethics

This was a retrospective single-center study conducted in the Juliana Children’s Hospital in The Hague, the Netherlands. The hospital is a secondary care hospital, which accommodates approximately 7,000 annual visits to the pediatric emergency department (ED). In the Netherlands, the meteorological summer period is from the start of June until the end of August, and winter is from the start of December until the end of February. We included all patients aged 0-18 years presenting to the ED and diagnosed with LRTI, from January 1, 2019 through December 31, 2021. For inclusion, we searched the patients for diagnoses based on the codes of the International Classification of Disease 10th Revision, including J09-J22, J40, J96, J98, and J99. Since the 2021 respiratory epidemic had a more gradual ending than usual, it was difficult to clearly define an LRTI season each year. The COVID-19 pandemic contained 2 lockdown periods, including March 2020-July 2020 and October 2020-April 2021 (9). Instead, we compared calendar years for the analysis. Respectively, 2019, 2020, and 2021 represented the years of pre-pandemic, of lockdown, and of reopening of society.
Data were manually collected from the medical records of each patient. Patients who did not visit the ED prior to hospitalization, e.g., transfers from other hospitals, were excluded. If study patients were transferred from the ED to another hospital for logistical reasons, e.g., exceeding ward capacity, they were included in analyses of ED data but excluded from analyses of hospitalization data. The study protocol was submitted to the medical ethics committee of Leiden-Delft-Den Haag in Leiden, the Netherlands, which judged that the protocol did not fall under the purview of the Dutch Law for Research with Human subjects and that informed consent was not mandatory (IRB no. N22.035).

2. Variables of interest

The following variables were collected from medical records. Patient characteristics included age, sex, gestational age, underlying medical conditions (e.g., underlying genetic-/syndromal-, cardiac-, pulmonary-, gastrointestinal-, or immunological conditions), atopic history, and number of respiratory ED visits or hospitalizations in the past year. Clinical data included initial oxygen saturation, heart rate, respiratory rate, signs of respiratory distress, clinical diagnosis (bronchiolitis vs. pneumonia), hospitalization, length of stay (time until discharge from the pediatric ward), transfers to the pediatric intensive care unit (PICU), and applications of salbutamol, antibiotics, steroids, oxygen, or nasogastric tubes. Temperatures were not collected due to variations in pretreatment with paracetamol. Routine viral testing was implemented in 2021 for all patients hospitalized with respiratory complaints, in contrast to in 2019 and 2020 when the testing was performed rarely at the discretion of the treating physician.

3. Definitions

The underlying medical conditions were defined as chronic conditions for which the patient received treatment or regular follow-up at the time of ED presentation. Atopic history was defined as a history of eczema, allergic rhinitis, food allergy, asthma, or preschool wheezing. If the treating physician provided a working diagnosis of bronchiolitis or pneumonia in the medical record, this was considered a clinical diagnosis. Otherwise, criteria in Appendix 1 (https://doi.org/10.22470/pemj.2023.00836), based on the local practice, were used to classify the patients. We excluded patients without clear clinical diagnosis or symptom suggestive of LRTI reported on the medical records.

4. Statistical analysis

Data were analyzed using R version 4.1.2 (RStudio, PBC). Monthly numbers of ED visits or hospitalizations from 2019 through 2021 were depicted, as well as detected viral pathogens in 2021. Patient characteristics and clinical data were compared respectively between 2021 and 2019, and between 2020 and 2019, using independent 2-sample t-tests, Mann-Whitney U-tests, chi-square tests, or Fisher exact tests. A P value of < 0.05 was considered statistically significant. To compare hospitalization criteria between the years, we first determined clinical predictors for hospitalization using univariable logistic regression analysis for individual predictors using the age, sex, underlying medical conditions, oxygen saturation at ED arrival, respiratory rate, heart rate, signs of respiratory distress, clinical diagnosis, and bronchodilator use at the ED. Predictors with a P value of < 0.1 were put into a multivariable logistic regression model for each individual year. A sub-analysis was performed for patients with bronchiolitis or pneumonia regarding their age, sex, and hospitalization.

Results

1. Population and baseline characteristics

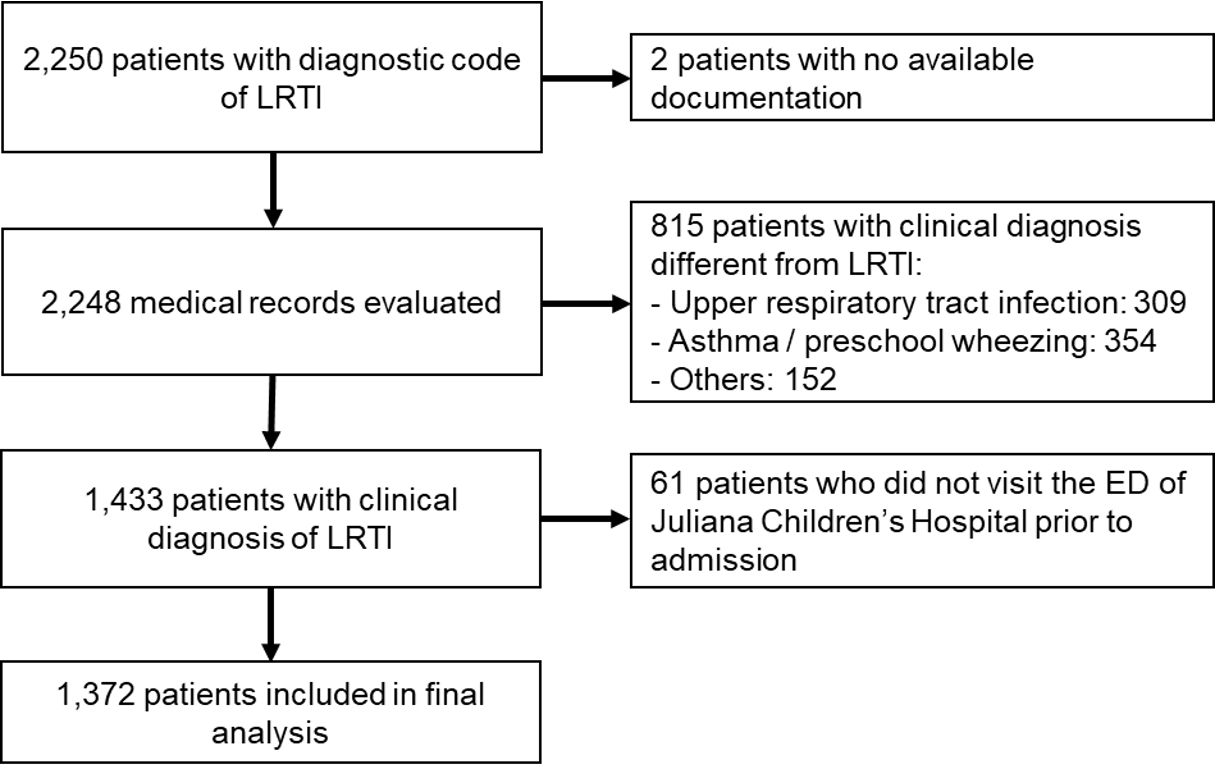
A total of 1,372 patients with diagnostic codes for LRTIs met the inclusion criteria (Fig. 1). Of the included patients, 42.9% (n = 588) were boys. Thirty-five percent of the study population had underlying medical conditions, of which obstructive lung disease (OLD) was most common. Annual numbers of ED visits for LRTI in the Juliana Children’s Hospital were 573, 280, and 519, in the order of years. Data regarding ED visits and hospitalization are summarized in Tables 1 and 2. Additional information on underlying medical conditions is provided in Appendices 2 and 3 (https://doi.org/10.22470/pemj.2023.00836).

2. Monthly numbers of ED visits

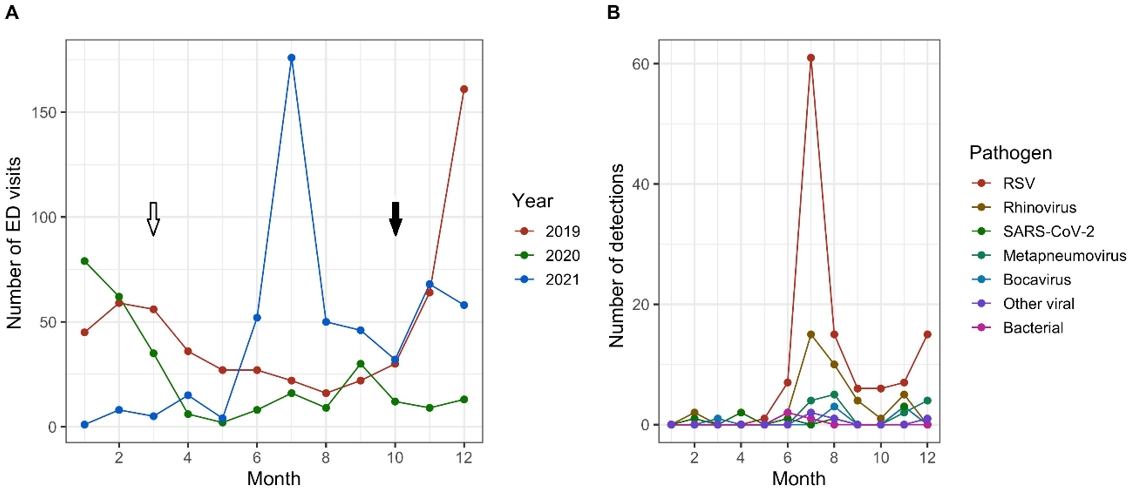
In 2019, LRTI rate was highest in winter, with the peak in December (Fig. 2A). The start of the first lockdown in March 2020 correlated with a sharp decrease in ED visits. An inter-seasonal epidemic began after the end of the second lockdown and peaked in July 2021, with 176 cases diagnosed in a single month, 9% higher than during the peak in December 2019. Detected viral pathogens in 2021 are depicted in Fig. 2B.

3. Characteristics and disease severity of ED visits (Table 1)

The patients presenting with LRTI in 2021 had a lower median age compared to 2019, whereas the median age was higher in 2020 than 2019. Sixty-four percent of ED presentations in 2021 were diagnosed with bronchiolitis, compared to 48.0% in 2019 (P < 0.001), and larger proportions of patients presented with co-occurring symptoms of OLD in 2020 and 2021, than in 2019. Oxygen saturation was lower in the patients presenting in 2021. There were no significant differences in tachycardia, median respiratory rate, or signs of respiratory distress. The patients had fewer ED presentations or hospitalizations due to respiratory causes in the past year, and were less often treated with antibiotics in 2021 compared to 2019.

4. Characteristics and disease severity of hospitalizations (Table 2)

The hospitalization rate in 2020 was similar to that in 2019, but increased in 2021. More patients with bronchiolitis were hospitalized in 2021 compared to 2019, while antibiotic prescriptions were less frequent in the former year. In 2020, fewer nasogastric tubes were inserted than in 2019. The proportion of patients needing oxygen administration was similar in all 3 years. Median length of stay was slightly shorter in 2020. Sub-analysis for the patients with bronchiolitis showed a higher median age in 2020 (0.7 years) compared to 2019 (0.5 years; P = 0.006), but not in 2021 (0.6 years; P = 0.203) (Appendix 4, https://doi.org/10.22470/pemj.2023.00836). Of all patients with bronchiolitis in 2021, 62.3% were hospitalized, a value significantly higher than 51.3% in 2019 (P = 0.008). No significant difference in hospitalization rate was found (51.3% in 2021 vs. 46.0% in 2019; P = 0.291) for the patients with pneumonia (Appendix 5, https://doi.org/10.22470/pemj.2023.00836).

5. Predictors for hospitalization 2019-2021

To evaluate whether changes in practice influenced the analysis results, we estimated which characteristics present at ED presentations were predictors for hospitalization in the 3 years (Table 3). In all 3 years, oxygen saturation (odds ratios, 0.73, 0.70, and 0.72 in the order of years) and age (0.68, 0.73, and 0.70) were common predictors for hospitalization, without remarkable differences in the odds ratios among the years. Tachypnea was a predictor in 2019 (1.03) and in 2021 (1.02). Underlying genetic condition (7.61), causing for example developmental delay or mental retardation, and retractions at the ED (2.42) were significant risk factors in 2019 only.

Discussion

COVID-19 public health restrictions reduced the incidence of pediatric LRTIs. The patients who visited the ED were older in 2020 than in 2019. Relaxation of the restrictions in 2021 led to an unprecedented summer peak of pediatric LRTIs. A shift in clinical diagnoses was observed, with more bronchiolitis and fewer pneumonia cases in 2021, with a lower median age of patients. Generally, compared to 2019, the severity of LRTI increased in 2021. The finding is supported by the increases in the frequencies of desaturation, bronchiolitis, co-occurring symptoms of OLD, and hospitalization, and the decrease in the median age of patients. Possibly, this change stemmed from viral causes since we found increase in bronchiolitis cases with the RSV surge in July 2021, and decrease in antibiotic therapy.
ED presentations in 2020, a period of successive lockdowns, comprised a smaller, older cohort. Although not significant, bronchiolitis-related visits decreased in 2020. In 2020 and 2021, larger proportions had co-occurring symptoms of OLD than in 2019. This change might be attributed to the persistence of rhinovirus during the lockdown periods (35-37).
We observed an inter-seasonal peak of pediatric LRTIs in the summer of 2021, similar to other Northern Hemisphere countries (23-25,38). The patients who visited the ED in 2021 were younger and more often diagnosed with bronchiolitis, instead of pneumonia. This is in contrast to previous studies predominantly reporting post-pandemic or -lockdown populations whose ages were similar or higher than pre-pandemic populations, except a brief report from New York, which described a lower median age (23,26,28,29,34,39). In 2021, a larger proportion had coexisting symptoms of OLD, which cannot be fully explained by the rhinoviral persistence (37). A possible explanation could be immune system overactivity after periods of low infection burden. This would be in line with the hygiene hypothesis, a theory proposing an inverse correlation between early childhood pathogen exposure and asthma development (40,41).
The higher hospitalization rate and lower oxygen saturation in 2021 suggest a more severe clinical phenotype, mainly accounted for by bronchiolitis cases. The cases that necessitated transfer to the PICU doubled in 2021, compared to 2019. However, not all variables that are representative of disease severity differed, e.g., respiratory rate, symptoms of respiratory distress upon arrival, and length of stay. Still, oxygen saturation, hospitalization rate, and PICU hospitalization rate are important objective indicators for the severity. Sub-analyses for bronchiolitis cases alone showed a significantly higher hospitalization rate in 2021 compared to 2019 with similar median ages in the 2 groups. Therefore, the seemingly more severe disease cannot be explained by the younger age of the patients who visited in 2021. A possible explanation could be immunity debt, a theory warning for paucity of immunity after extended periods of low pathogen exposure and subsequent vulnerable population (30,32).
This is the most comprehensive analysis of Dutch ED visits and hospitalizations for LRTI during the COVID-19 pandemic to date. Results from other countries are mixed. Increased intensive care requirements (45% to 81%) in RSV-positive admissions in New York suggested a more severe clinical phenotype (23). However, a shorter length of stay and decreased PICU requirement in patients admitted with RSV were reported in France, indicating a more benign course of disease (34). Other studies report no change in disease severity based on an evaluation of clinical outcomes, including length of stay, oxygen administration, and admission rate (25,27,30). However, these studies mainly focused on RSV, excluding other viral LRTIs.
Our study has some limitations. First, its retrospective nature made us dependent on the accuracy of clinical statuses. Criteria to differentiate between bronchiolitis and pneumonia may differ among treating physicians. Therefore, sub-analyses should be interpreted with caution. The absence of data for transfer-out in the medical records might have misled the retrospective evaluation of disease severity. Additionally, the context of unusually high patient burden during the summer of 2021 may have affected our findings. For example, the referral policy from primary care might have been stricter than usual. The hospital discharge threshold might have been lower as well, which could reduce the reliability of length of stay as a surrogate for the severity. Clinical criteria were used when a clear diagnosis was not listed in the medical records, which may have led to misclassification.
The strengths of the study include the relatively large population for a single center. Additionally, we minimized the effect of differences in clinical practice and changing medical teams between the years by including both direct (e.g., saturation) and indirect (e.g., length of stay) variables for disease severity. Furthermore, by comparing predictors for hospitalization, we have shown that, at least for most criteria for hospitalization, such a difference in clinical practice did not exist.
In conclusion, the number of pediatric LRTI-related visits increased in 2021, particularly during the summer, after the successive lockdowns and near absence of the LRTI in 2020. Additionally, the patients were younger in 2021 than in 2019. In 2021, patients seem to have had a more severe clinical phenotype. This might be explained by immunity debt after the COVID-19 lockdown, stricter referral policy, or changes in healthcare-seeking behavior. A larger proportion of patients showed symptoms of OLD. Future research is needed to evaluate long-term consequences of growing up during lockdown.

Notes

Author contributions

Conceptualization, Methodology, Resources, Software, Validation, and Visualization: MCMN, JB, MVV, and MDK

Data curation: MCMN, MVZ, and MDK

Formal analysis: MCMN and MDK

Funding acquisition: MDK

Investigation: all authors

Project administration and Supervision: MDK

Writing-original draft: MCMN and MDK

Writing-review and editing: MVZ, AS, JB, and MVV

All authors read and approved the final manuscript.

Conflicts of interest

No potential conflicts of interest relevant to this article were reported.

Funding sources

This study was supported by the Schumacher Kramer Foundation.

Data availability

All data presented in this manuscript is available from the corresponding author upon reasonable request.

Fig. 1.
Flowchart for selection of the study population. LRTI: lower respiratory tract infection, ED: emergency department.
pemj-2023-00836f1.jpg
Fig. 2.
Monthly trends of LRTI-related ED visits from 2019 through 2021 (A) and detected viral pathogens in 2021 (B). (A) In 2019, the visits peaked in December. The start of the first lockdown in March 2020 (white arrow), coincided with a sharp decrease in visits. During the rest of the year, including after the start of the second lockdown (black arrow) and the first half of 2021, the visits remained low without a winter peak. An inter-seasonal LRTI epidemic began after the end of the second lockdown (April 2021) and peaked in July 2021. (B) Among the detected viral pathogens in 2021, RSV was most common. LRTI: lower respiratory tract infection, ED: emergency department, RSV: respiratory syncytial virus, SARS-CoV-2: severe acute respiratory syndrome coronavirus 2.
pemj-2023-00836f2.jpg
Table 1.
Baseline features, clinical conditions upon presentation, and applied treatments in the ED (N = 1,372)
Variable 2019 (N = 573) 2020 (N = 280) P value* 2021 (N = 519) P value
Age, y 1.3 (0.5-3.5) 2.0 (0.8-4.5) < 0.001 1.1 (0.4-2.5) 0.003
Girls 238 (41.5) 124 (44.3) 0.494 226 (43.5) 0.542
Gestational age, wk 0.046 0.814
 > 37 511 (89.2) 253 (90.4) 459 (88.4)
 32-37 42 (7.3) 11 (3.9) 39 (7.5)
 < 32 19 (3.3) 16 (5.7) 21 (4.0)
Any UMC§ 183 (31.9) 91 (32.5) 0.958 133 (25.6) 0.023
Atopic history 165 (28.8) 85 (30.4) 0.729 142 (27.4) 0.611
Respiratory ED visits in past year 0.721 < 0.001
 None 369 (64.4) 186 (66.4)|| 390 (75.1)
 1 111 (19.4) 48 (17.1)|| 83 (16.0)
 > 1 93 (16.2) 46 (16.4)|| 46 (8.9)
Respiratory hospitalizations in past year 0.326 0.002
 None 470 (82.0) 218 (77.9) 462 (89.0)
 1 62 (10.8) 39 (13.9) 41 (7.9)
 > 1 41 (7.2) 23 (8.2) 16 (3.1)
SpO2, % 0.474 0.003
> 94 330 (57.6) 149 (53.2) 252 (48.6)||
90-94 157 (27.4) 87 (31.1) 176 (33.9)||
< 90 72 (12.6) 35 (12.5) 88 (17.0)||
Not measured 14 (2.4) 9 (3.2) 3 (0.6)||
Tachycardia, beats/min** 31.9 ± 22.8 32.6 ± 20.8 0.693 31.7 ± 22.0 0.868
Respiratory rate, breaths/min** 9 (1-19) 9 (3-19) 0.314 9 (2-19) 0.187
Signs of respiratory distress 320 (55.8) 168 (60.0) 0.286 313 (60.3) 0.081
 Nasal flaring 58 (10.1) 35 (12.5) 0.361 47 (9.1) 0.684
 Retractions 309 (53.9) 165 (58.9) 0.204 304 (58.6) 0.081
Bronchiolitis‡‡ 275 (48.0) 120 (42.9) 0.178 332 (64.0) < 0.001
Co-occurring symptoms of OLD 118 (20.6) 84 (30.0) 0.003 153 (29.5) < 0.001
Salbutamol MDI/nebulization 236 (41.2) 143 (51.1) 0.006 247 (47.6) 0.033
Antibiotics 303 (52.9) 166 (59.3) 0.153 209 (40.3) < 0.001
Systemic corticosteroids 38 (6.6) 27 (9.6) 0.102 50 (9.6) 0.181
Hospitalization 278 (48.5) 153 (54.6) 0.114 303 (58.4) 0.001
 Transferred to other centers§§ 16 (5.8) 3 (2.0) 0.066 33 (10.9) 0.026
Return visit < 3 wk 100 (17.5) 44 (15.7) 0.559 83 (16.0) 0.672

Values are expressed as medians (interquartile ranges), numbers (%), or means ± standard deviations

* 2019 vs. 2020.

2019 vs. 2021.

One patient had missing data.

§ See details in Appendix 2.

|| The sum of proportions is not equal to 100% due to rounding.

Not included in chi-squared analysis.

** Above age-adjusted normal values.

†† Mutually inclusive.

‡‡ All non-bronchiolitis was pneumonia.

§§ The denominators are 278, 153, and 303 in the order of rows.

ED: emergency department, UMC: underlying medical condition, OLD: obstructive lung disease, MDI: metered dose inhaler.

Table 2.
Clinical characteristics of children hospitalized to the pediatric ward (N = 682*)
Variable 2019 (N = 262) 2020 (N = 150) P value 2021 (N = 270) P value
Age, y 1.1 (0.5-2.9) 2.1 (0.8-4.6) 0.002 0.9 (0.3-2.3) 0.232
Girls 113 (43.1) 71 (47.3) 0.473 117 (43.3) > 0.999
Gestational age, wk 0.201 0.591
 > 37 218 (83.2) 134 (89.3)§ 235 (87.0)§
 32-37 33 (12.6) 11 (7.3)§ 26 (9.6)§
 < 32 11 (4.2) 5 (3.3)§ 9 (3.3)§
Any UMC|| 92 (35.1) 51 (34.0) 0.879 72 (26.7) 0.041
Atopic history 70 (26.7) 49 (32.7) 0.256 75 (27.8) 0.904
Bronchiolitis 130 (49.6) 62 (41.3) 0.134 181 (67.0) < 0.001
Salbutamol MDI/nebulization 138(52.7) 88 (58.7) 0.239 165 (61.1) 0.049
Antibiotics 160 (61.1) 97 (64.7) 0.571 121 (44.8) < 0.001
Systemic corticosteroids 29 (11.1) 21 (14.0) 0.471 40 (14.8) 0.217
O2 support 218 (83.2) 116 (77.3) 0.138 236 (87.4) 0.169
Total days on O2 3 (1-5) 2 (1-4) 0.006 3 (2-4) 0.111
NGT 0.041 0.412
 No NGT 162 (61.8)§ 118 (78.7) 190 (70.4)
 1-3 d 27 (10.3)§ 9 (6.0) 26 (9.6)
 > 3 d 41 (15.6)§ 17 (11.3) 35 (13.0)
Pre-existent NGT/unknown** 32 (12.2)§ 6 (4.0) 19 (7.0)
PICU admission 5 (1.9) 1 (0.7) 0.424 10 (3.7) 0.303
Length of stay, d 3 (2-5) 2 (2-4) 0.025 3 (2-4) 0.102
Return visit < 3 wk 34 (13.0) 19 (12.7) > 0.999 27 (10.0) 0.355

Values are expressed as medians (interquartile ranges) or numbers (%).

* Of the 734 hospitalized patients, 52 transferred to other hospitals for logistic reasons.

2019 vs. 2020.

2019 vs. 2021.

§ The sum of proportions is not equal to 100% due to rounding.

|| See details in Appendix 3.

All non-bronchiolitis was pneumonia.

** Not included in chi-squared analysis.

UMC: underlying medical condition, MDI: metered dose inhaler, NGT: nasogastric tube, PICU: pediatric intensive care unit.

Table 3.
Predictors for hospitalization, comparison between 2019, 2020, and 2021
Predictor 2019 2020 2021
OR (95% CI) P value OR (95% CI) P value OR (95% CI) P value
Age, y* 0.68 (0.57-0.81) < 0.001 0.73 (0.57-0.94) 0.013 0.70 (0.59-0.84) < 0.001
Underlying genetic condition 7.61 (2.29-30.6) 0.002 1.50 (0.25-1.00) 0.652 1.13 (0.28-5.11) 0.871
SpO2 at ED arrival, %* 0.73 (0.67-0.78) < 0.001 0.70 (0.62-0.78) < 0.001 0.72 (0.66-0.77) < 0.001
Tachypnea* 1.03 (1.01-1.06) 0.002 1.00 (0.98-1.03) 0.641 1.02 (1.00-1.04) 0.017
Tachycardia* 1.00 (0.99-1.02) 0.344 1.00 (0.99-1.02) 0.384 1.00 (0.99-1.01) 0.432
Retractions at the ED 2.42 (1.49-3.94) < 0.001 1.27 (0.67-2.42) 0.465 1.24 (0.76-2.05) 0.387

* Continuous variable. ORs correspond with increment of 1 year for age, 1% for SpO2, 1 breath/minute for tachypnea, and 1 beat/minute for tachycardia.

Adjusted for age.

OR: odds ratio, CI: confidence interval, ED: emergency department.

References

1. Schrijver TV, Brand PL, Bekhof J. Seasonal variation of diseases in children: a 6-year prospective cohort study in a general hospital. Eur J Pediatr 2016;175:457–64.
crossref pmid pdf
2. Finkelman BS, Viboud C, Koelle K, Ferrari MJ, Bharti N, Grenfell BT. Global patterns in seasonal activity of influenza A/H3N2, A/H1N1, and B from 1997 to 2005: viral coexistence and latitudinal gradients. PLoS One 2007;2:e1296.
crossref pmid pmc
3. Lipsett SC, Monuteaux MC, Fine AM. Seasonality of common pediatric infectious diseases. Pediatr Emerg Care 2021;37:82–5.
crossref pmid
4. Ben-Shimol S, Greenberg D, Hazan G, Shemer-Avni Y, Givon-Lavi N, Dagan R. Seasonality of both bacteremic and nonbacteremic pneumonia coincides with viral lower respiratory tract infections in early childhood, in contrast to nonpneumonia invasive pneumococcal disease, in the pre-pneumococcal conjugate vaccine era. Clin Infect Dis 2015;60:1384–7.
crossref pmid
5. Florin TA, Plint AC, Zorc JJ. Viral bronchiolitis. Lancet 2017;389:211–24.
crossref pmid
6. Jin Y, Yang H, Ji W, Wu W, Chen S, Zhang W, et al. Virology, epidemiology, pathogenesis, and control of COVID-19. Viruses 2020;12:372.
crossref pmid pmc
7. World Health Organization (WHO). WHO coronavirus (COVID-19) dashboard: Measures [Internet]. WHO; 2020 [cited 2022 Apr 1]. Available from: https://covid19.who.int/measures.

8. Government of the Netherlands. Coronavirus timeline [Internet]. Government of the Netherlands; 2021 [cited 2022 Mar 14]. Available from: https://www.rijksoverheid.nl/onderwerpen/coronavirus-tijdlijn. Dutch.

9. Kruizinga MD, Noordzij JG, van Houten MA, Wieringa J, Tramper-Stranders GA, Hira V, et al. Effect of lockdowns on the epidemiology of pediatric respiratory disease: a retrospective analysis of the 2021 summer epidemic. Pediatr Pulmonol 2023;58:1229–36.
crossref pmid pdf
10. Launay T, Souty C, Vilcu AM, Turbelin C, Blanchon T, Guerrisi C, et al. Common communicable diseases in the general population in France during the COVID-19 pandemic. PLoS One 2021;16:e0258391.
crossref pmid pmc
11. Sullivan SG, Carlson S, Cheng AC, Chilver MB, Dwyer DE, Irwin M, et al. Where has all the influenza gone? The impact of COVID-19 on the circulation of influenza and other respiratory viruses, Australia, March to September 2020. Euro Surveill 2020;25:2001847.
crossref pmid pmc
12. Kuitunen I, Artama M, Mäkelä L, Backman K, Heiskanen-Kosma T, Renko M. Effect of social distancing due to the COVID-19 pandemic on the incidence of viral respiratory tract infections in children in finland during early 2020. Pediatr Infect Dis J 2020;39:e423–7.
crossref pmid
13. Kishimoto K, Bun S, Shin JH, Takada D, Morishita T, Kunisawa S, et al. Early impact of school closure and social distancing for COVID-19 on the number of inpatients with childhood non-COVID-19 acute infections in Japan. Eur J Pediatr 2021;180:2871–8.
crossref pmid pmc pdf
14. Tanislav C, Kostev K. Fewer non-COVID-19 respiratory tract infections and gastrointestinal infections during the COVID-19 pandemic. J Med Virol 2022;94:298–302.
crossref pmid pmc pdf
15. Van Brusselen D, De Troeyer K, Ter Haar E, Vander Auwera A, Poschet K, Van Nuijs S, et al. Bronchiolitis in COVID-19 times: a nearly absent disease? Eur J Pediatr 2021;180:1969–73.
crossref pmid pmc pdf
16. Stera G, Pierantoni L, Masetti R, Leardini D, Biagi C, Buonsenso D, et al. Impact of SARS-CoV-2 pandemic on bronchiolitis hospitalizations: the experience of an Italian tertiary center. Children (Basel) 2021;8:556.
crossref pmid pmc
17. Lumley SF, Richens N, Lees E, Cregan J, Kalimeris E, Oakley S, et al. Changes in paediatric respiratory infections at a UK teaching hospital 2016-2021; impact of the SARS-CoV-2 pandemic. J Infect 2022;84:40–7.
crossref pmid pmc
18. Rybak A, Yang DD, Schrimpf C, Guedj R, Levy C, Cohen R, et al. Fall of community-acquired pneumonia in children following COVID-19 non-pharmaceutical interventions: a time series analysis. Pathogens 2021;10:1375.
crossref pmid pmc
19. Yeoh DK, Foley DA, Minney-Smith CA, Martin AC, Mace AO, Sikazwe CT, et al. Impact of coronavirus disease 2019 public health measures on detections of influenza and respiratory syncytial virus in children during the 2020 Australian winter. Clin Infect Dis 2021;72:2199–202.
crossref pmid pmc pdf
20. Britton PN, Hu N, Saravanos G, Shrapnel J, Davis J, Snelling T, et al. COVID-19 public health measures and respiratory syncytial virus. Lancet Child Adolesc Health 2020;4:e42–3.
crossref pmid pmc
21. Varela FH, Scotta MC, Polese-Bonatto M, Sartor IT, Ferreira CF, Fernandes IR, et al. Absence of detection of RSV and influenza during the COVID-19 pandemic in a Brazilian cohort: likely role of lower transmission in the community. J Glob Health 2021;11:05007.
crossref pmid pmc
22. Chiapinotto S, Sarria EE, Mocelin HT, Lima JA, Mattiello R, Fischer GB. Impact of non-pharmacological initiatives for COVID-19 on hospital admissions due to pediatric acute respiratory illnesses. Paediatr Respir Rev 2021;39:3–8.
crossref pmid pmc
23. Agha R, Avner JR. Delayed seasonal RSV surge observed during the COVID-19 pandemic. Pediatrics 2021;148:e2021052089.
crossref pmid pdf
24. Delestrain C, Danis K, Hau I, Behillil S, Billard MN, Krajten L, et al. Impact of COVID-19 social distancing on viral infection in France: a delayed outbreak of RSV. Pediatr Pulmonol 2021;56:3669–73.
crossref pmid pmc pdf
25. Weinberger Opek M, Yeshayahu Y, Glatman-Freedman A, Kaufman Z, Sorek N, Brosh-Nissimov T. Delayed respiratory syncytial virus epidemic in children after relaxation of COVID-19 physical distancing measures, Ashdod, Israel, 2021. Euro Surveill 2021;26:2100706.
pmid pmc
26. Masarweh K, Gur M, Bar-Yoseph R, Bentur L, Dabaja-Younis H. Characterization of respiratory illness surge (April-June 2021) post-COVID-19 lockdown. Pediatr Pulmonol 2022;57:667–73.
crossref pmid pdf
27. Foley DA, Phuong LK, Peplinski J, Lim SM, Lee WH, Farhat A, et al. Examining the interseasonal resurgence of respiratory syncytial virus in Western Australia. Arch Dis Child 2022;107:e7.
crossref pmid
28. Foley DA, Yeoh DK, Minney-Smith CA, Martin AC, Mace AO, Sikazwe CT, et al. The interseasonal resurgence of respiratory syncytial virus in Australian children following the reduction of coronavirus disease 2019-related public health measures. Clin Infect Dis 2021;73:e2829–30.
crossref pmid pmc pdf
29. Saravanos GL, Hu N, Homaira N, Muscatello DJ, Jaffe A, Bartlett AW, et al. RSV epidemiology in Australia before and during COVID-19. Pediatrics 2022;149:e2021053537.
crossref pmid pdf
30. Hatter L, Eathorne A, Hills T, Bruce P, Beasley R. Respiratory syncytial virus: paying the immunity debt with interest. Lancet Child Adolesc Health 2021;5:e44–5.
crossref pmid pmc
31. Cohen R, Ashman M, Taha MK, Varon E, Angoulvant F, Levy C, et al. Pediatric Infectious Disease Group (GPIP) position paper on the immune debt of the COVID-19 pandemic in childhood, how can we fill the immunity gap? Infect Dis Now 2021;51:418–23.
crossref pmid pmc
32. Cohen R, Pettoello-Mantovani M, Somekh E, Levy C. European Pediatric Societies call for an implementation of regular vaccination programs to contrast the immunity debt associated to coronavirus disease-2019 pandemic in children. J Pediatr 2022;242:260–261.e3.
crossref pmid pmc
33. Camporesi A, Morello R, Ferro V, Pierantoni L, Rocca A, Lanari M, et al. Epidemiology, microbiology and severity of bronchiolitis in the first post-lockdown cold season in three different geographical areas in Italy: a prospective, observational study. Children (Basel) 2022;9:491.
crossref pmid pmc
34. Fourgeaud J, Toubiana J, Chappuy H, Delacourt C, Moulin F, Parize P, et al. Impact of public health measures on the post-COVID-19 respiratory syncytial virus epidemics in France. Eur J Clin Microbiol Infect Dis 2021;40:2389–95.
crossref pmid pmc pdf
35. Abe N, Yasudo H, Fukano R, Nakamura T, Okada S, Wakiguchi H, et al. Multi-season analyses of causative pathogens in children hospitalized with asthma exacerbation. Pediatr Allergy Immunol 2019;30:724–31.
crossref pmid pmc pdf
36. Kengne-Nde C, Kenmoe S, Modiyinji AF, Njouom R. Prevalence of respiratory viruses using polymerase chain reaction in children with wheezing, a systematic review and meta-analysis. PLoS One 2020;15:e0243735.
crossref pmid pmc
37. Reukers DF, van Asten L, Brandsema PS, Dijkstra F, Hendriksen JM, Hooiveld M, et al. Annual report surveillance of COVID-19, influenza and other respiratory infections in the Netherlands: winter 2020/2021 [Internet]. National Institute for Public Health and the Environment; 2021 [cited 2022 Aug 9]. Available from: https://www.rivm.nl/bibliotheek/rapporten/2021-0133.pdf.

38. Tenenbaum T, Doenhardt M, Diffloth N, Berner R, Armann JP. High burden of RSV hospitalizations in Germany 2021-2022. Infection 2022;50:1587–90.
crossref pmid pmc pdf
39. Cardenas J, Pringle C, Filipp SL, Gurka MJ, Ryan KA, Avery KL. Changes in critical bronchiolitis after COVID-19 lockdown. Cureus 2022;14:e25064.
crossref pmid pmc
40. Garn H, Potaczek DP, Pfefferle PI. The hygiene hypothesis and new perspectives-current challenges meeting an old postulate. Front Immunol 2021;12:637087.
crossref pmid pmc
41. Brooks C, Pearce N, Douwes J. The hygiene hypothesis in allergy and asthma: an update. Curr Opin Allergy Clin Immunol 2013;13:70–7.
pmid

Appendices

Appendix 1

Definitions for clinical diagnoses

Clinical diagnosis Definition
Upper airway infection Stuffy nose or nasal discharge with absence of wheezing, rhonchi, or crackles
Bronchiolitis A child < 2 y of age with dyspnea, prolonged expiration, diffuse crackles, rhonchi and/or wheezing and no clear improvement upon salbutamol inhalations
Pneumonia Unilateral crackles in a child < 2 y or bilateral crackles in children > 2 y
Co-occurring obstructive lung disease Wheezing and clinical improvement upon treatment with beta2-agonist, suggesting asthma or preschool wheezing
Appendix 2

Underlying medical conditions on ED presentations

ED presentations (N = 1,372) 2019 (N = 573) 2020 (N = 280) P value 2021 (N = 519) P value
At least one 183 (31.9) 91 (32.5) 0.960 133 (25.6) 0.023
 Obstructive lung disease 131 (22.9) 70 (25) 0.569 112 (21.6) 0.634
 Other respiratory conditions 18 (3.1) 7 (2.5) 0.762 4 (0.8) 0.010
 Cardiovascular 11 (1.9) 5 (1.8) 3 (0.6)
 Gastrointestinal 11 (1.9) 5 (1.8) 3 (0.6)
 Renal 4 (0.7) 2 (0.7) 2 (0.4)
 Neuromuscular 34 (5.9) 10 (3.6) 10 (1.9)
 Metabolic/endocrine 8 (1.4) 7 (2.5) 4 (2.2)
 Genetic 31 (5.4) 11 (2.9) 15 (2.9)
 Others* 11 (1.9) 7 (2.5) 33 (0.6)

Values are expressed as numbers (%).

* Hematologic, immune deficiency, or rheumatic.

ED: emergency department.

Appendix 3

Underlying medical conditions on hospitalizations

ED presentations (N = 682) 2019 (N = 262) 2020 (N = 150) P value 2021 (N = 270) P value
At least one 92 (35.1) 51 (34.0) 0.882 72 (26.7) 0.041
 Obstructive lung disease 55 (21.0) 39 (26.0) 0.320 58 (21.5) > 0.999
 Other respiratory conditions 12 (4.6) 6 (4.0) 0.984 3 (1.1) 0.031
 Cardiovascular 8 (3.1) 5 (3.3) 2 (0.7)
 Gastrointestinal 8 (3.1) 5 (3.3) 2 (0.7)
 Renal 3 (1.1) 0 (0) 2 (0.7)
 Neuromuscular 28 (10.7) 5 (3.3) 6 (2.2)
 Metabolic/endocrine 5 (1.9) 5 (3.3) 4 (1.5)
 Genetic 24 (9.2) 8 (5.3) 10 (3.7)
 Others* 6 (2.3) 6 (4.0) 2 (0.7)

Values are expressed as numbers (%).

* Hematologic, immune deficiency, or rheumatic.

ED: emergency department.

Appendix 4

Sub-analysis for bronchiolitis

ED presentations (N = 727) 2019 (N = 275) 2020 (N = 120) P value 2021 (N = 332) P value
Age, y 0.5 (0.3-0.9) 0.7 (0.4-1.2) 0.006 0.6 (0.3-1.1) 0.203
Girls 101 (36.7) 41 (34.2) 0.707 140 (42.2) 0.201
Hospitalization 141 (51.3) 64 (53.3) 0.793 207 (62.3) 0.008

Values are expressed as medians (interquartile ranges) or numbers (%).

ED: emergency department.

Appendix 5

Ophthalmic severity

ED presentations (N = 645) 2019 (N = 298) 2020 (N = 160) P value 2021 (N = 187 ) P value
Age, y 3.3 (1.9-5.6) 4.0 (2.2-6.1) 0.044 3.1 (2.0-5.1) 0.95
Girls 137 (46.0) 83 (51.9) 0.263 86 (46.0) 0.999
Hospitalization 137 (46.0) 89 (55.6) 0.064 96 (51.3) 0.291

Values are expressed as medians (interquartile ranges) or numbers (%).

ED: emergency department.

TOOLS
PDF Links  PDF Links
PubReader  PubReader
ePub Link  ePub Link
XML Download  XML Download
Full text via DOI  Full text via DOI
Download Citation  Download Citation
Share:      
METRICS
0
Crossref
819
View
49
Download
Related article
Editorial Office
The Korean Society of Pediatric Emergency Medicine
Chungmu-building office 213, 197, Toegye-ro, Jung-gu, Seoul 04557, Korea
TEL: +82-2-3674-7888   FAX: +82-2-3674-7889   E-mail: pemjpublisher@gmail.com
About |  Browse Articles |  Current Issue |  For Authors
Copyright © Korean Society of Pediatric Emergency Medicine.                 Developed in M2PI
Close layer
prev next