| Home | E-Submission | Sitemap | Contact us |  
top_img
Pediatric Emergency Medicine Journal > Volume 10(1); 2023 > Article
Onubogu, West, and Azubogu: 나이지리아의 단일 3차 병원 소아응급병동에 입원한 소아 사망률 양상

Abstract

Purpose

This study was performed to review the mortality pattern at the emergency ward (EW) of the Rivers State University Teaching Hospital, Port Harcourt, Nigeria.

Methods

A retrospective review of mortality among children hospitalized in the EW was conducted from January 2015 through May 2017. Information on their age, sex, weight, diagnosis, and mortality was recorded. The data were expressed in frequencies, and logistic regressions were performed with mortality as the dependent variable.

Results

The median age of the 1,020 children hospitalized in the EW was 1.0 year (interquartile range, 0.6-4.0) with death recorded in 60 children, a 5.9% mortality rate. Mortality was higher in the children younger than 2 years, boys, and those with infectious diseases. Of the 60 dead children, infectious diseases were the leading cause of mortality (53 [88.3%]) with sepsis (22 [36.7%]), gastroenteritis (10 [16.7%]), and meningitis (6 [10.0%]), accounting for the highest contributors to mortality. The highest case fatality rates were noted in tetanus (1/1 [100%]), human immunodeficiency virus (5/14 [35.7%]), and tuberculosis (2/7 [28.6%]). The logistic regression showed that age of 13-16 years (adjusted odds ratio, 4.59; 95% confidence interval, 1.80-11.20; compared with age < 2 years) and presence of infectious diseases (4.65; 1.80-12.10) significantly increased the risk of mortality.

Conclusion

The mortality rate in our EW during the study period was 5.9%. Infectious diseases remained significant contributors to mortality in our practice. Greater efforts at prevention and control of the diseases are required to correct this negative trend.

Introduction

Globally, there has been a remarkable improvement in children’s survival over the past 3 decades. However, continued efforts are required to further reduce their mortality rates because many children still die from preventable diseases, particularly in the developing countries1). Infectious diseases, such as pneumonia, diarrhea, and malaria, remain a leading cause of death in children younger than 5 years, along with preterm birth and intrapartum-related complications1).
Emergency units represent the first point of care for the critically ill children, and their death in emergency wards (EWs) is challenging to the clinicians or families who have to deal with it2). Mortality in EWs depends on geographic regions. In developed countries, mortalities have been reported to be below 1%3,4). In contrast, studies from developing countries have reported mortalities range from 2.8% to 4.1% among children hospitalized in EWs5,6). The mortality in Nigeria ranges from 2% to 13.6%7-9).
Worldwide variations have also been reported in the causes of death in EWs. Whereas trauma and cardiovascular diseases were important causes in developed countries3,4), infectious diseases predominate in the developing countries in sub-Saharan Africa7-9).
Factors associated with mortality in EWs vary among different authors. A Nigerian study reported that the mortality was higher in the first 24 hours of hospitalization and during the dry months of the year as well as in children younger than 3 years7,9). Other factors include low socioeconomic status, malnutrition, and a previous episode of diarrhea as reported in Ghana5).
It is vital to study the pattern of mortality in EWs. Such a study provides the trend and distribution of diseases, data for the planning of disease prevention and control programs, and an opportunity for the emergency care team to evaluate its standard of care and improve on areas of concern. The present study sought to analyze the mortality pattern among children hospitalized in the EW of the Rivers State University Teaching Hospital, Port Harcourt, southern Nigeria.

Methods

This was a retrospective review of the patient register of the EW from January 2015 through May 2017. This study was approved by the hospital health research ethics committee (IRB no. RSUTH/REC/2022228). The emergency unit renders health care for all children aged 16 years or younger. All children seen in the emergency unit can either be hospitalized into the EW or the special care baby unit of the hospital if they are aged 28 days or younger while those not requiring hospitalization are discharged after their consults.
Data of all hospitalizations within the study period were entered into an Excel spreadsheet (Microsoft, Redmond, WA). Information on their age, age groups (< 2, 2-5, 6-12, and 13-16 years), sex, weight, diagnosis, and mortality was recorded. Diseases that occurred once or did not belong to any group were classified as others with exception of those in whom mortality occurred. A weight for age Z-score was used to classify nutritional status. The case fatality rate (CFR) was defined as the number of mortalities among those with diseases.
To determine risk factors for mortality, we performed multivariable logistic regressions with backward stepwise variable selection using mortality as the dependent variable. Variables with up to 20% missing data were excluded from being put into the model. Results were reported as adjusted odds ratios (aORs) and 95% confidence intervals (CIs). Data were analyzed using IBM SPSS ver. 23.0 for Windows (IBM Corp., Armonk, NY). Data distribution was also expressed in frequency tables and charts.

Results

1. Description of mortality

The number of children hospitalized during the study period was 1,020 with a median age of 1.0 year (interquartile range, 0.6-4.0). Mortality was recorded in 60 (5.9%). Among the age groups, children aged < 2 years showed the highest mortality of 66.7%, followed by those aged 6-12 years (9 [15.0%]) (Table 1). Mortality was higher in boys. Weights were not documented in 51.7% of the children with mortality. Among those with available weights, the majority of mortality occurred in those with normal weight (26.7%). Infectious diseases contributed to the majority of mortality in the EW (88.3%).

2. Diagnoses of the hospitalized children and their age distribution

The most common diagnosis was malaria (19.9%), followed by acute respiratory infection (17.7%), gastroenteritis (11.3%), sepsis (10.9%), and acute asthma (7.1%) (Table 2). The 180 children with acute respiratory infection consist of 100 with tonsillitis (9.8%), 66 with bronchopneumonia (6.5%), and 14 with bronchiolitis (1.4%). The 115 children with gastroenteritis consist of 106 with non-bloody diarrhea (10.4%) and 9 with dysentery (0.9%). Children younger than 2 years had a similar pattern of hospitalization as the overall population. In older children, the most common reason for hospitalization into the EW was acute asthma, as shown by 28 (16.9%) and 8 (18.2%) in those aged 6-12 years and aged 13-16 years, respectively.

3. Risk factors for mortality

Among the age groups, the highest mortality of 15.9% (7 of the 44 children) was noted in the children aged 13-16 years. In univariable analysis, the age group’s mortality was higher than that of other groups (aOR, 2.75; 95% CI, 1.15-6.56; compared with age < 2 years) (Appendix 1; https://doi.org/10.22470/pemj.2022.00598). The mortality rate of the children aged 2-5 years was lowest among the age groups (1.5% [2 of the 137]). The type of disease and nutritional status significantly affected the mortality. The underweight children had a higher mortality of 12.8% (3.80; 1.68-8.36; compared with normal weight). Those with infectious diseases had a higher mortality rate of 7.3% (4.10; 1.68-10.47; compared with non-communicable diseases).
We performed the multivariable logistic regressions to ascertain the effect of age group and presence of infectious diseases (Table 3). The regression model was statistically significant (χ2 = 20.6, P < 0.001). It explained 59% of the variance observed in the mortalities and correctly classified 94% of the mortalities observed. Resultantly, independent factors associated with mortality were the age of 13-16 years (aOR, 4.59; 95% CI, 1.80-11.20; compared with age < 2 years) and the presence of infectious diseases (4.65; 1.80-12.10).

4. Causes of mortality

Sepsis contributed to the highest number of mortalities (22 [36.7%]), followed by gastroenteritis (16.7%) and meningitis (10.0%) (Fig. 1). The CFR was highest in tetanus (100%), followed by human immunodeficiency virus (35.7%) and tuberculosis (28.6%) (Fig. 2).

Discussion

In the present study, the 5.9% mortality of children hospitalized to the EW was comparable with 5.1% and 6.2% reported respectively in Enugu10) and Umuahia11) of southeastern Nigeria, but higher than 4.1%, 3.9%, 2.5%, and 1.6% reported respectively in Ethiopia6), a more recent study in Enugu7), India12) and Mozambique13). However, the 5.9% was lower than 7.6%, 9.6%, 10.6%, 11.1%, and 11.6% documented in other regions of Nigeria14-16).
The varying mortalities are attributable to the difference in geographic regions or time, as observed in the studies in Enugu7,10). Of note, children in developing countries, especially in sub-Saharan Africa, still have a relatively high mortality, which is 14 times higher than the equivalent values in Europe and North America1). The high mortality could be attributed to poorly developed health policies, poor funding, inadequate manpower, and infrastructure. Other factors for high mortality in EWs are delayed visits, financial constraints due to the unavailability or lack of enforcement of the National Health Insurance Scheme, delayed interventions, and inadequate support services17). Hence, a multidisciplinary approach is needed to reduce childhood mortality in Port Harcourt, which is located in sub-Saharan Africa.
Seventy percent of the mortality in the EW was observed in the children aged 5 years or younger. This high mortality in the young children was also documented by other researchers7,10,14-16,18). This tendency may stem from this group being more prone to poor outcomes due to their immature immunity against common infections. Therefore, the finding prompts the implementation of already existing preventive measures for childhood diseases, and timely diagnosis and treatment.
Infectious diseases were responsible for over 75% of mortality in the present study. This finding corroborates studies in some regions of Nigeria7,10,14,16,19), and the Democratic Republic of Congo20), and reports by the World Health Organization stating infectious diseases as the leading cause of childhood mortality1,21). Contrary to the above studies, Jofiro et al.6) in Ethiopia reported cardiovascular and infectious diseases as the most and the third common cause of death, respectively. This disparity could be attributed to differences in the study population. The population in the Ethiopian study included neonates who have a higher prevalence of congenital heart diseases, unlike the other studies which excluded neonates6). It is notable that infectious diseases, common entities in sub-Saharan Africa, could be prevalent due to the combination of lack of immunization and low socioeconomic status.
The odds of mortality were about 5 times higher among the children aged 13-16 years, as well as among those with infectious diseases. Globally, mortality falls from the peak at age younger than 5 years to trough at age of 10-14 years, and increases again in older adolescents and young adults22). This increase in mortality stems from the fact that older adolescents are in a critical period of transition to adulthood. This period is associated with certain health risks, which lead to increased mortality23). The risks include road traffic accidents, abuse of alcohol or substance, risks in workplace, reproductive risks, and other non-communicable diseases. Thus, interventions to improve survival of older adolescents should be strengthened by multidisciplinary approaches, such as improvement of education, transportation, road infrastructure, and law enforcement.
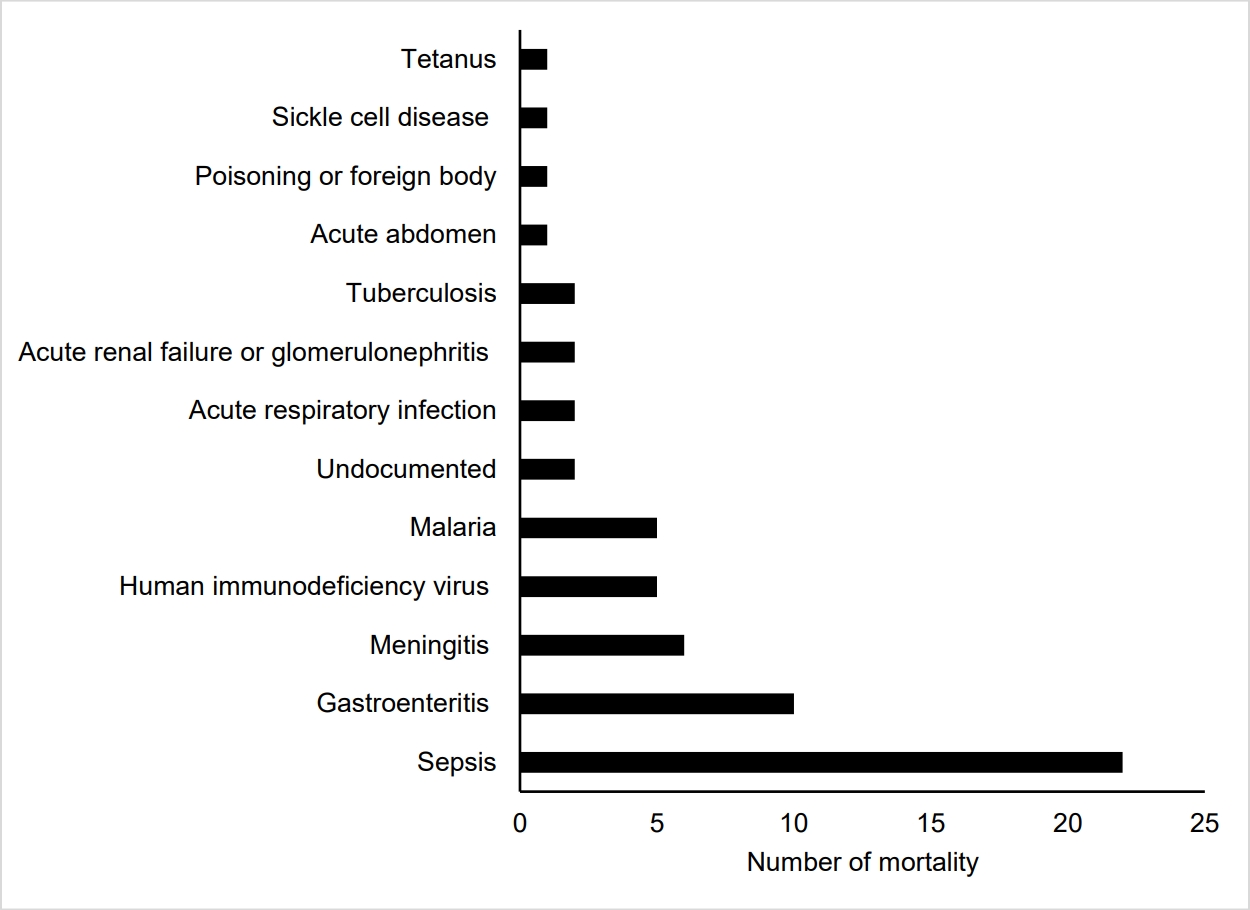
Sepsis was the most common cause of death in the EW. This finding is consistent with the equivalent findings reported by Edelu et al.7), Enyuma et al.8), and Ndukwu and Onah18) in Enugu, Calabar, and Nnewi in Nigeria, respectively. In contrast, this finding is contrary to other regions in the country. In Aba and Bauchi, Nigeria, severe malaria was the leading cause of death whereas anemic heart failure was documented in Bayelsa14-16). In Ethiopia and Malawi, pneumonia was the leading cause of death6,24). Such differences may be related to the variations according to geographic regions, even in the same country, or over time.
CFR was highest in infectious diseases, such as tetanus (100%), human immunodeficiency virus (35.7%), and tuberculosis (28.6%), in the present study. Notably, the most common causes of death were also infectious diseases. Infectious diseases accounting for the highest CFR were also documented in a 4-year retrospective study in Umuahia where meningitis (28.6%), sepsis (17.1%), and malaria (3.3%) had the highest CFR19).
As a limitation, there were incomplete or missing data due to the retrospective study design. Thus, we encourage to use of an electronic health management system to store medical records in good condition.
The mortality of children hospitalized in the EW of the Rivers State University Teaching Hospital was 5.9% with a preponderance of age younger than 2 years, boys, and infectious diseases. The mortality mostly occurred from infectious diseases (88.3%) with sepsis, gastroenteritis, and meningitis being the leading causes of death in descending order. The odds of mortality were 4.6-4.7 times higher for children with infectious diseases or for those aged 13-16 years. Hence, policies should be made with general health reforms to improve pediatric health care, as well as to strengthen the already existing preventive and curative programs. The urgent need to strengthen the primary health care system with the enforcement of the national insurance scheme cannot be over-emphasized.

Notes

Conflicts of interest

No potential conflicts of interest relevant to this article were reported.

Funding sources

No funding source relevant to this article was reported.

Fig. 1.
Diseases that contributed to mortality in the emergency ward (n = 60). The numerical data were as follows: sepsis, 22 (36.7%); gastroenteritis, 10 (16.7%); meningitis, 6 (10.0%); human immunodeficiency virus, 5 (8.3%); malaria, 5 (8.3%); acute respiratory infection, 2 (3.3%); acute renal failure or glomerulonephritis, 2 (3.3%); tuberculosis, 2 (3.3%); undocumented, 2 (3.3%); acute abdomen, 1 (1.7%); poisoning or foreign body, 1 (1.7%); sickle cell disease, 1 (1.7%); and tetanus, 1 (1.7%).
pemj-2022-00598f1.jpg
Fig. 2.
Case fatality rate of diseases in the emergency ward. The numerical data were as follows: tetanus, 1/1 (100%); human immunodeficiency virus, 5/14 (35.7%); tuberculosis, 2/7 (28.6%); acute renal failure or glomerulonephritis, 2/8 (25.0%); sepsis, 22/111 (19.8%); meningitis, 6/61 (9.8%); undocumented, 2/22 (9.1%); gastroenteritis, 10/115 (8.7%); poisoning or foreign body, 1/12 (8.3%); acute abdomen, 1/18 (5.6%); sickle cell disease, 1/29 (3.4%); malaria, 5/203 (2.5%); and acute respiratory infection, 2/180 (1.1%).
pemj-2022-00598f2.jpg
Table 1.
Description of mortality in the emergency ward, Rivers State University Teaching Hospital, Port Harcourt, Nigeria
Category Data (N = 60)
Age group, y
 < 2* 40 (66.7)
 2-5 2 (3.3)
 6-12 9 (15.0)
 13-16 7 (11.7)
 Age unrecorded 2 (3.3)
Sex
 Boys 32 (53.3)
 Girls 26 (43.3)
 No data 2 (3.3)
Weight for age Z-score
 Normal (2 to -2) 16 (26.7)
 Underweight (< -2) 12 (20.0)
 Overweight (> 2) 1 (1.7)
 Weight unrecorded 31 (51.7)
Disease type
 Infectious/communicable diseases 53 (88.3)
 Non-communicable diseases 5 (8.3)
 Disease unrecorded 2 (3.3)

Values are expressed as numbers (%).

* Excluding neonates.

The sums of proportions are not equal to 100% due to rounding.

Table 2.
Diagnoses of the children hospitalized to the emergency ward with their age distribution
Diagnosis Total (N = 1,020)* < 2 y (N = 622)* 2-5 y (N = 137)* 6-12 y (N = 166)* 13-16 y (N = 44) No age data (N = 51)*
Malaria 203 (19.9) 129 (20.7) 39 (28.5) 22 (13.3) 7 (15.9) 6 (11.8)
Acute respiratory infection 180 (17.6) 141 (22.7) 15 (10.9) 15 (9.0) 2 (4.5) 7 (13.7)
Gastroenteritis 115 (11.3) 89 (14.3) 12 (8.8) 8 (4.8) 4 (9.1) 2 (3.9)
Sepsis 111 (10.9) 90 (14.5) 4 (2.9) 9 (5.4) 1 (2.3) 7 (13.7)
Acute asthma 72 (7.1) 17 (2.7) 13 (9.5) 28 (16.9) 8 (18.2) 6 (11.8)
Trauma 63 (6.2) 14 (2.3) 13 (9.5) 26 (15.7) 6 (13.6) 4 (7.8)
Meningitis 61 (6.0) 32 (5.1) 8 (5.8) 14 (8.4) 3 (6.8) 4 (7.8)
Others 30 (2.9) 15 (2.4) 1 (0.7) 10 (6.0) 0 (0) 4 (7.8)
Sickle cell disease 29 (2.8) 3 (0.5) 7 (5.1) 10 (6.0) 5 (11.4) 4 (7.8)
Undocumented 22 (2.2) 13 (2.1) 4 (2.9) 4 (2.4) 1 (2.3) 0 (0)
Acute abdomen 18 (1.8) 11 (1.8) 2 (1.5) 3 (1.8) 2 (4.5) 0 (0)
Cellulitis and dermatitis 15 (1.5) 9 (1.4) 3 (2.2) 2 (1.2) 0 (0) 1 (2.0)
Human immunodeficiency virus 14 (1.4) 8 (1.3) 4 (2.9) 1 (0.6) 1 (2.3) 0 (0)
Parental anxiety 13 (1.3) 11 (1.8) 2 (1.5) 0 (0) 0 (0) 0 (0)
Poisoning/foreign body 12 (1.2) 6 (1.0) 3 (2.2) 2 (1.2) 0 (0) 1 (2.0)
Cardiac pathology 8 (0.8) 8 (1.3) 0 (0) 0 (0) 0 (0) 0 (0)
Inguinoscrotal pathology 8 (0.8) 7 (1.1) 0 (0) 0 (0) 0 (0) 1 (2.0)
Renal pathology§ 8 (0.8) 4 (0.6) 3 (2.2) 1 (0.6) 0 (0) 0 (0)
Sexual assault 7 (0.7) 0 (0) 1 (0.7) 6 (3.6) 0 (0) 0 (0)
Tuberculosis 7 (0.7) 5 (0.8) 0 (0) 0 (0) 1 (2.3) 1 (2.0)
Conjunctivitis/periorbital cellulitis 6 (0.6) 3 (0.5) 1 (0.7) 1 (0.6) 0 (0) 1 (2.0)
Urinary tract infection 4 (0.4) 1 (0.2) 0 (0) 1 (0.6) 2 (4.5) 0 (0)
Cancers 3 (0.3) 2 (0.3) 1 (0.7) 0 (0) 0 (0) 0 (0)
Measles/varicella 3 (0.3) 3 (0.5) 0 (0) 0 (0) 0 (0) 0 (0)
Pertussis 3 (0.3) 1 (0.2) 1 (0.7) 0 (0) 0 (0) 1 (2.0)
Anaphylaxis/urticaria 2 (0.2) 0 (0) 0 (0) 2 (1.2) 0 (0) 0 (0)
Typhoid 2 (0.2) 0 (0) 0 (0) 0 (0) 1 (2.3) 1 (2.0)
Tetanus 1 (0.1) 0 (0) 0 (0) 1 (0.6) 0 (0) 0 (0)

Values are expressed as numbers (%).

* The sums of proportions are not equal to 100% due to rounding.

Non-communicable diseases or diagnoses.

Diabetic ketoacidosis, osteomyelitis, non-cardiac congenital malformation, peptic ulcer diseases, helminthiasis, dysfunctional uterine bleeding, menorrhagia, laryngomalacia, Hirschsprung’s disease, biliary atresia, upper gastrointestinal tract bleeding, epistaxis, difficulty in hearing, hydrocephalus, hyperemic growth per vagina, acute stroke, stool impaction, scabies, hypoxic-ischemic encephalopathy, hypokalemia, cholelithiasis, lymphoproliferative disorders, uterine prolapse, and urethral stricture following circumcision.

§ Acute renal failure or glomerulonephritis.

Table 3.
Multivariable logistic regression for mortality in the emergency ward
Variable Adjusted odds ratio (95% confidence interval ) P value
Age group, y
 < 2 Reference Reference
 13-16 4.59 (1.80-11.20) 0.001
Infectious/communicable diseases 4.65 (1.80-12.10) 0.001

References

1. World Health Organization (WHO). The global health observatory. Child mortality and causes of death [Internet]. Geneva: WHO: c2022 [cited 2022 Jun 13]. Available from: https://www.who.int/data/gho/data/themes/topics/topic-details/GHO/child-mortality-and-causes-of-death.

2. Whitehead PR. The lived experience of physicians dealing with patient death. BMJ Support Palliat Care 2014;4:271–6.
crossref pmid pmc
3. Zhu CP, Wu XH, Liang YT, Ma WC, Ren L. The mortality of patients in a pediatric emergency department at a tertiary medical center in China: an observational study. World J Emerg Med 2015;6:212–6.
crossref pmid pmc
4. Lopez E, Udaondo J, Olabarri M, Martinez-Indart L, Benito J, Mintegi S, et al. Mortality in Spanish pediatric emergency departments: a 5-year multicenter survey. Eur J Emerg Med 2017;24:392–7.
crossref pmid
5. Tette EMA, Nyarko MY, Nartey ET, Neizer ML, Egbefome A, Akosa F, et al. Under-five mortality pattern and associated risk factors: a case-control study at the Princess Marie Louise Children’s Hospital in Accra, Ghana. BMC Pediatr 2016;16:148.
crossref pmid pmc pdf
6. Jofiro G, Jemal K, Beza L, Bacha Heye T. Prevalence and associated factors of pediatric emergency mortality at Tikur Anbessa specialized tertiary hospital: a 5 year retrospective case review study. BMC Pediatr 2018;18:316.
crossref pmid pmc pdf
7. Edelu BO, Eze JN, Oguonu T, Ndu IK. Morbidity and mortality pattern in the children emergency unit of the University of Nigeria Teaching Hospital Enugu. Orient J Med 2014;26:73–8.

8. Enyuma CO, Ikpeme OE, Brown-Abang E, Uket H. Morbidity and mortality pattern in a children emergency room in Calabar, Nigeria. J Med Africa 2016;1:6–10.

9. Onyearugha CN, Okoronkwo NC, Onyemachi PE. Mortality pattern in children aged 1-60 months at a tertiary healthcare institution, in Southeast Nigeria. Ann Med Health Sci Res 2020;10:907–11.

10. Ibeziako SN, Ibekwe RC. Pattern and outcome of admissions in the children’s emergency room of the University of Nigeria Teaching Hospital, Enugu. Niger J Paed 2002;29:103–7.
crossref
11. Njoku PU, Iloh GU, Dienye PO, Korie FC, Ahaiwe VC. Pattern of paediatric conditions seen in the children emergency room of an urban hospital in South-Eastern Nigeria. GSC Biol Pharm Sci 2020;13:174–80.
crossref
12. Singhi S, Jain V, Gupta G. Pediatric emergencies at a tertiary care hospital in India. J Trop Pediatr 2003;49:207–11.
crossref pmid
13. Brugnolaro V, Fovino LN, Calgaro S, Putoto G, Muhelo AR, Gregori D, et al. Pediatric emergency care in a low-income country: characteristics and outcomes of presentations to a tertiary-care emergency department in Mozambique. PLoS One 2020;15:e0241209.
crossref pmid pmc
14. Duru C, Peterside O, Akinbami F. Pattern and outcome of admissions as seen in the paediatric emergency ward of the Niger Delta University Teaching Hospital, Bayelsa State, Nigeria. Niger J Paed 2013;40:232–7.

15. Okoronkwo NC, ChappJumbo AU. Pattern of morbidity and mortality of childhood illnesses at the children emergency room of Abia State University Teaching Hospital, Aba, Nigeria. East Central Afr Med J 2015;2:70–3.

16. Sa’ad YM, Hayatu A, Al-Mustapha II, Orahachi YM, Hauwa MU. Morbidity and mortality of childhood illnesses at the emergency pediatric unit of a tertiary hospital, north-eastern Nigeria. Sahel Med J 2015;18:1–3.
crossref
17. Molyneux EM. Paediatric emergency care in resource-constrained health services is usually neglected: time for change. Ann Trop Paediatr 2010;30:165–76.
crossref pmid
18. Ndukwu CI, Onah SK. Pattern and outcome of postneonatal pediatric emergencies in Nnamdi Azikiwe University Teaching Hospital, Nnewi, South East Nigeria. Niger J Clin Pract 2015;18:348–53.
crossref pmid
19. Ibeneme CA, Ezuruike EO, Korie FC, Chukwudi NK, Ukpabi IK. Morbidity pattern and outcome among under-fives at the children’s emergency room of Federal Medical Center Umuahia. Niger J Paediatr 2019;46:189–94.

20. Kingwengwe AA, Ndgadi AK, Lukusa PM, Ilunga PM, Ibeki EK, Kyanga PA, et al. Epidemiology of pediatric medical emergencies at the Kindu reference General Hospital (HGRK): state of affairs and perspectives. Open Access Libr J 2019;6:e5715.
crossref
21. World Health Organization (WHO). Children: improving survival and well-being 2020 [Internet]. Geneva: WHO: 2020[cited 2022 April 3]. Available from: https://www.who.int/news-room/fact-sheets/detail/children-reducing-mortality.

22. World Health Organization (WHO). Mortality among children aged 5-14 years. Geneva: WHO: 2019[cited 2022 July 11]. Available from: https://www.who.int/news-room/fact-sheets/detail/mortality-among-children-aged-5-14-years.

23. Mathers C. Deaths of older children: what do the data tell us? Lancet Glob Health 2015;3:e579–80.
crossref pmid
24. Ngwalangwa F, Phiri CHA, Dube Q, Langton J, Hildenwall H, Baker T. Risk factors for mortality in severely ill children admitted to a tertiary referral hospital in Malawi. Am J Trop Med Hyg 2019;101:670–5.
crossref pmid pmc

Appendices

Appendix 1

Univariable analysis

Variable Mortality rate (60/1,020 [5.9])* Adjusted odds ratio (95% confidence interval) P value
Age group, y
 < 2 40/622 (6.4) Reference Reference
 2-5 2/137 (1.5) 0.21 (0.05-0.90) 0.021
 6-12 9/166 (5.4) 0.83 (0.39-1.75) 0.632
 13-16 7 (15.9) 2.75 (1.15-6.56) 0.017
Boys 32/554 (5.8) 1.00 (0.60-1.70) > 0.999
Weight for age Z-score
 Normal weight 16/432 (3.7) Reference Reference
 Underweight 12/94 (12.8) 3.80 (1.68-8.36) < 0.001
 Overweight 1/74 (1.4) 0.35 (0.04-2.72) 0.299
Disease type
 Infectious/communicable diseases 53/729 (7.3) 4.10 (1.68-10.47) 0.002

* Values are expressed as numbers (%).

Editorial Office
The Korean Society of Pediatric Emergency Medicine
Chungmu-building office 213, 197, Toegye-ro, Jung-gu, Seoul 04557, Korea
TEL: +82-2-3674-7888   FAX: +82-2-3674-7889   E-mail: pemjpublisher@gmail.com
About |  Browse Articles |  Current Issue |  For Authors
Copyright © Korean Society of Pediatric Emergency Medicine.                 Developed in M2PI
Close layer
prev next